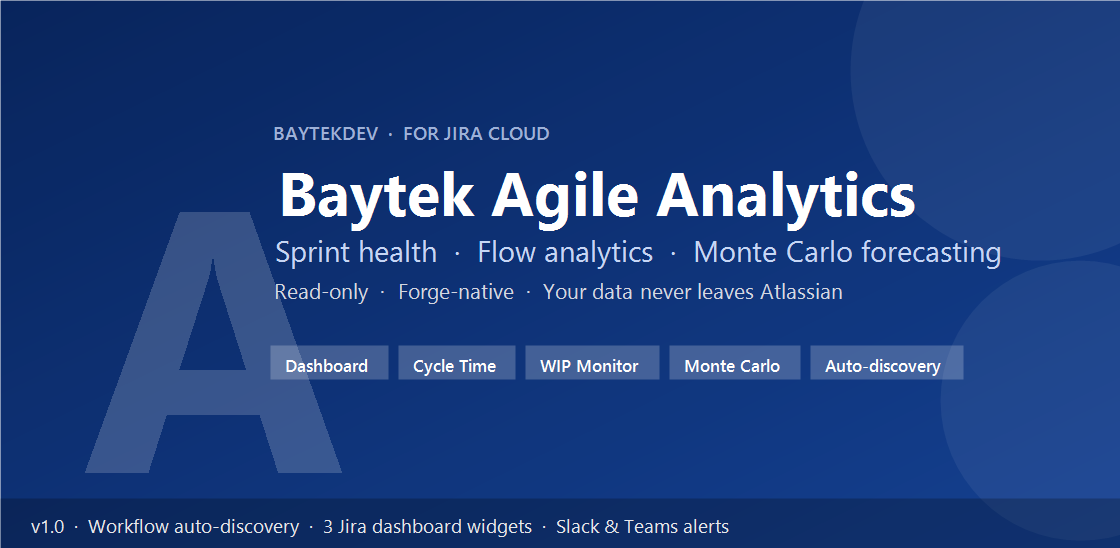
Baytek Agile Analytics
Sprint intelligence your team will actually use. Flow metrics, aging charts, Monte Carlo forecasting, and delivery signals — all inside Jira.
Built for teams who ship
No Setup Required
Install and go. Auto-detects your Jira workflows, boards, and sprints, and works with both Scrum and Kanban.
Privacy First
Read-only Jira access on Atlassian Forge. No third-party analytics backend. The only external traffic is optional Slack/Teams alert webhooks you choose to configure.
Dark Mode
Full light and dark theme support so the experience feels native to the Jira environment your teams already use.
Runs on Atlassian
Designed for trust-first rollout with Forge-native hosting, Atlassian Cloud boundaries, and enterprise-friendly controls.
Product walkthrough
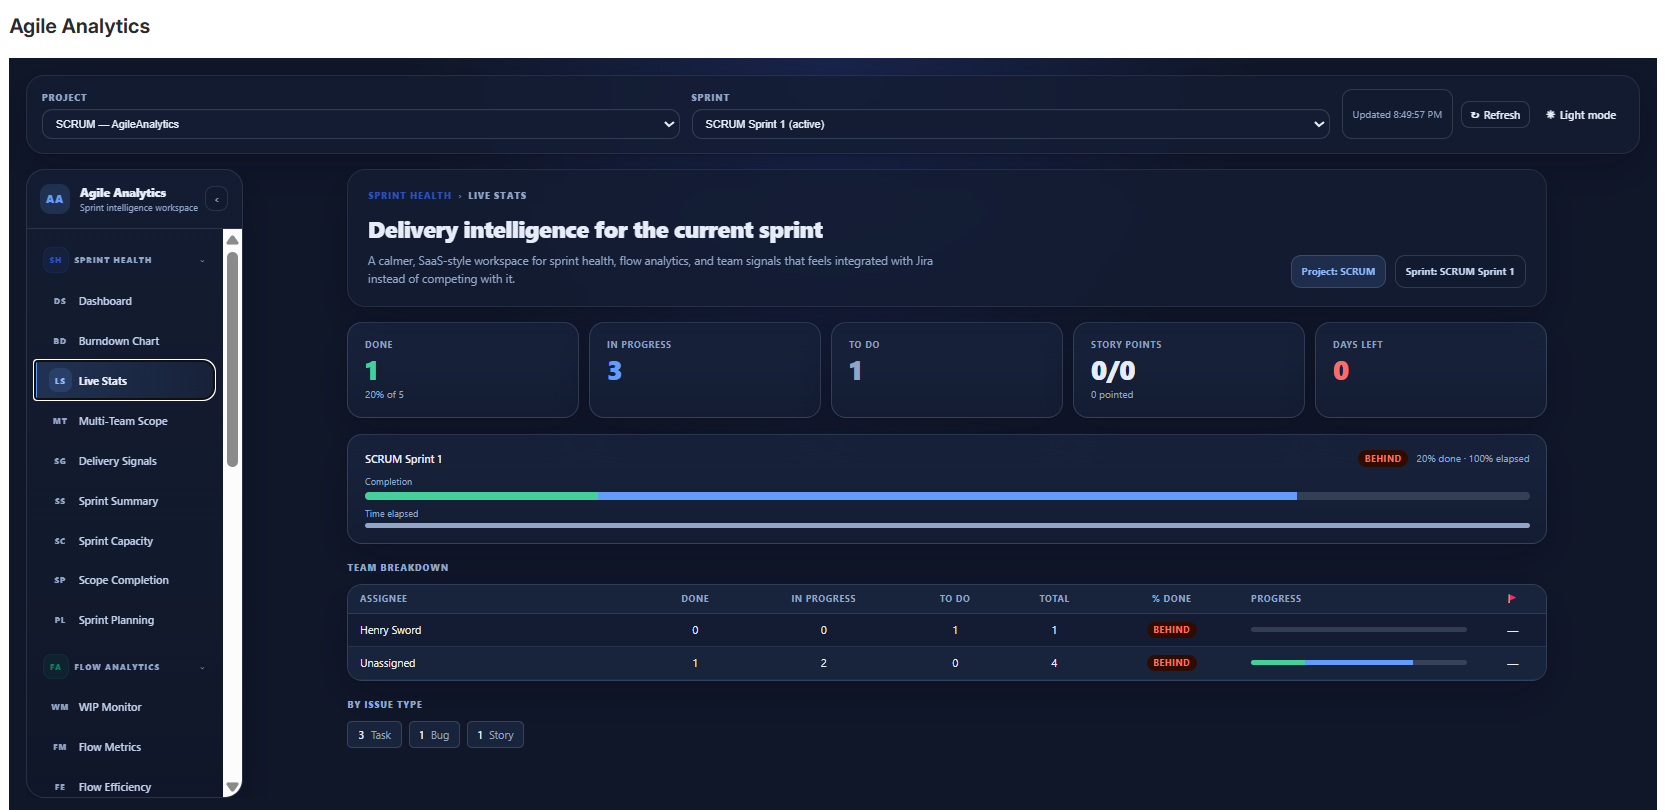
A calmer analytics workspace inside Jira
Built to feel like part of Jira instead of a disconnected reporting layer.
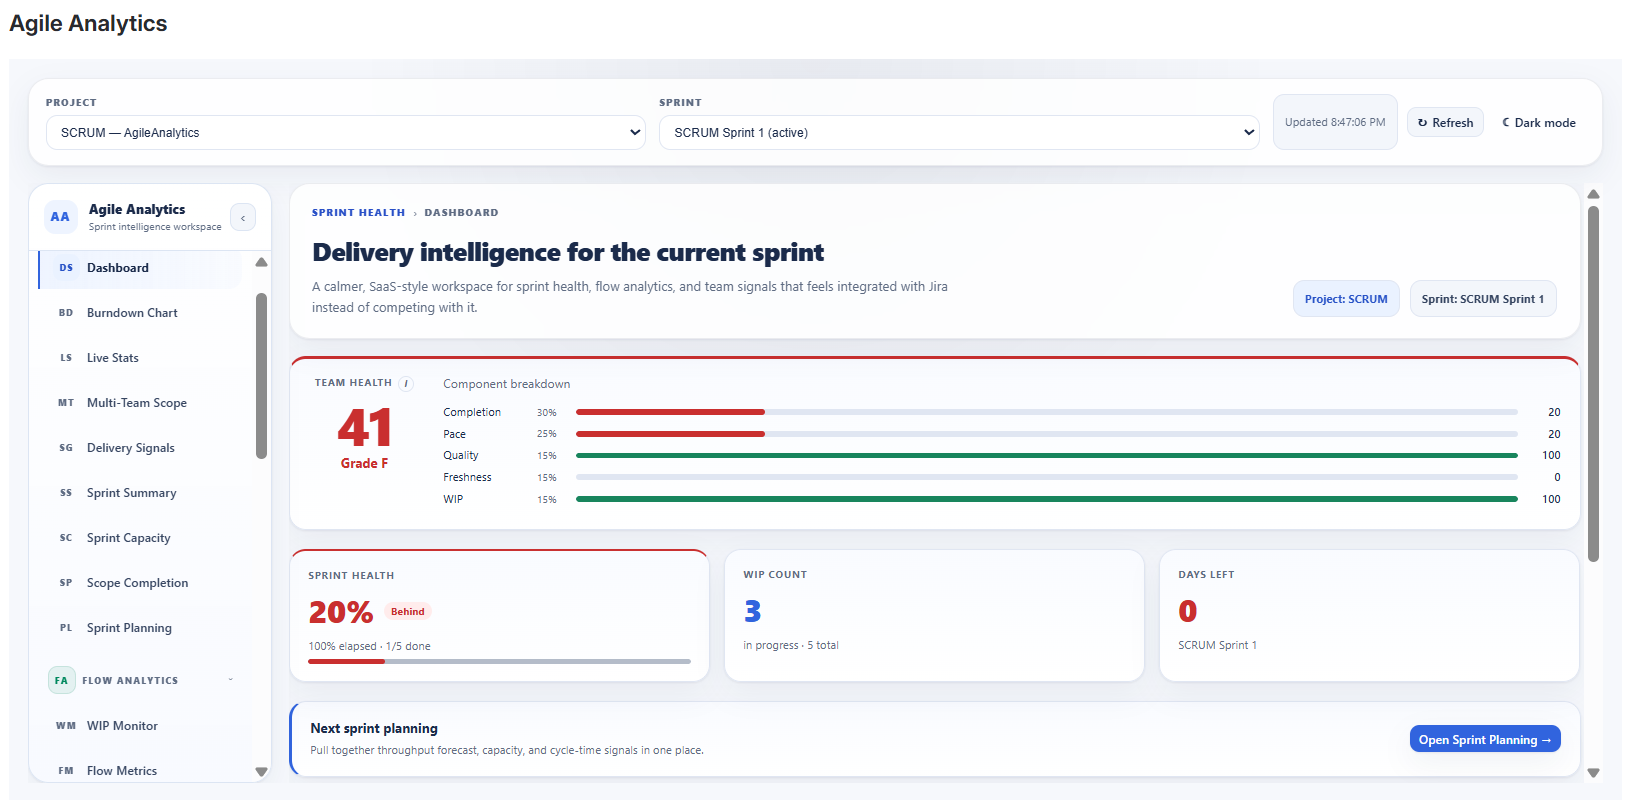
Sprint health workspace with KPI cards, role-based playbook, and guided quick links.
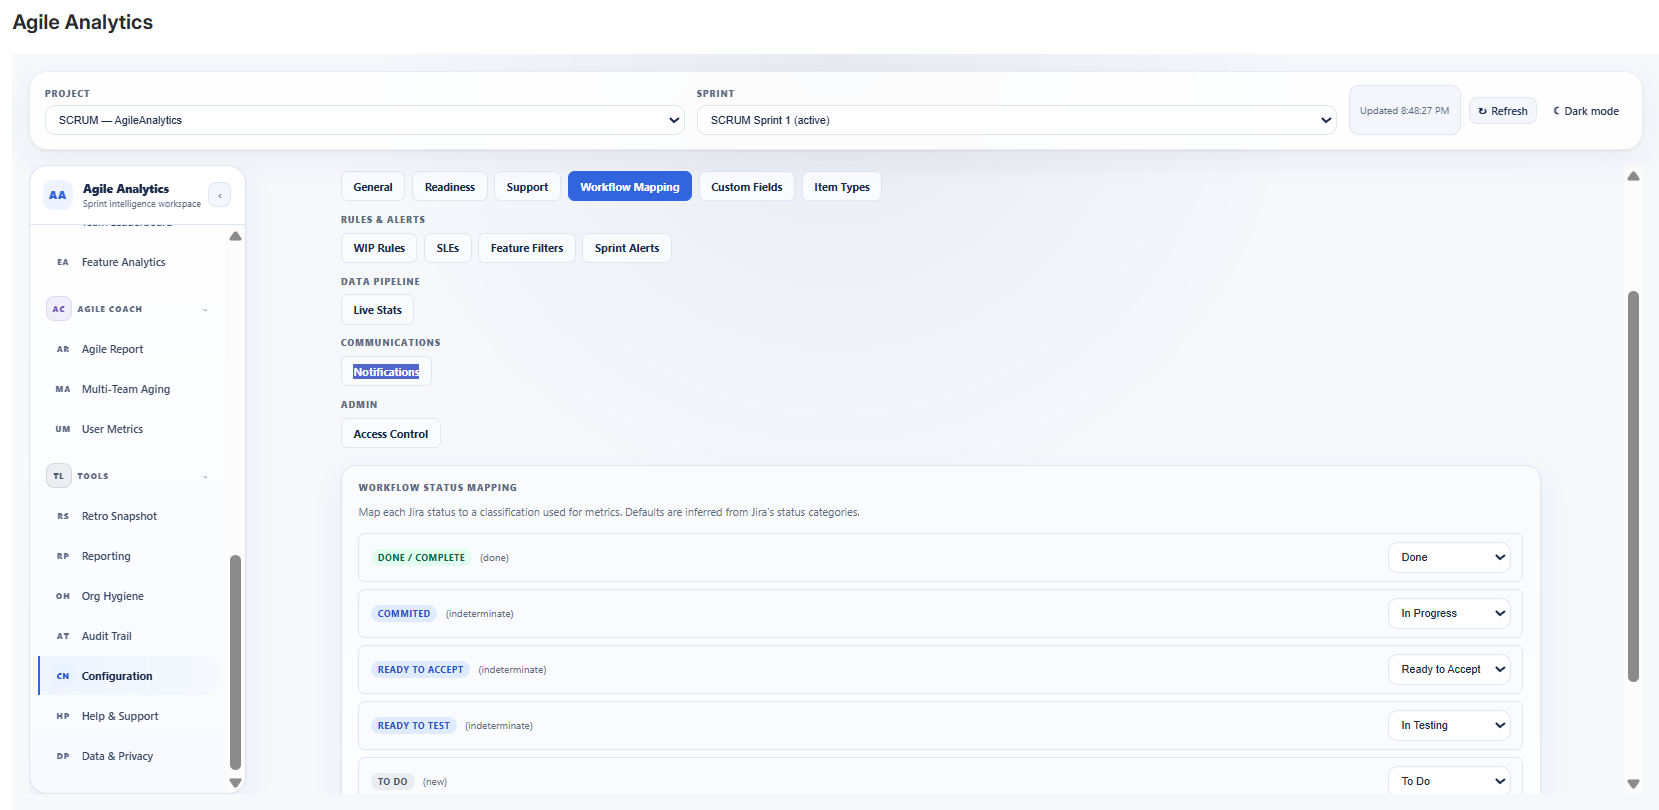
Workflow Mapping auto-discovers your Jira statuses and lets you fine-tune To Do / In Progress / Done per project.
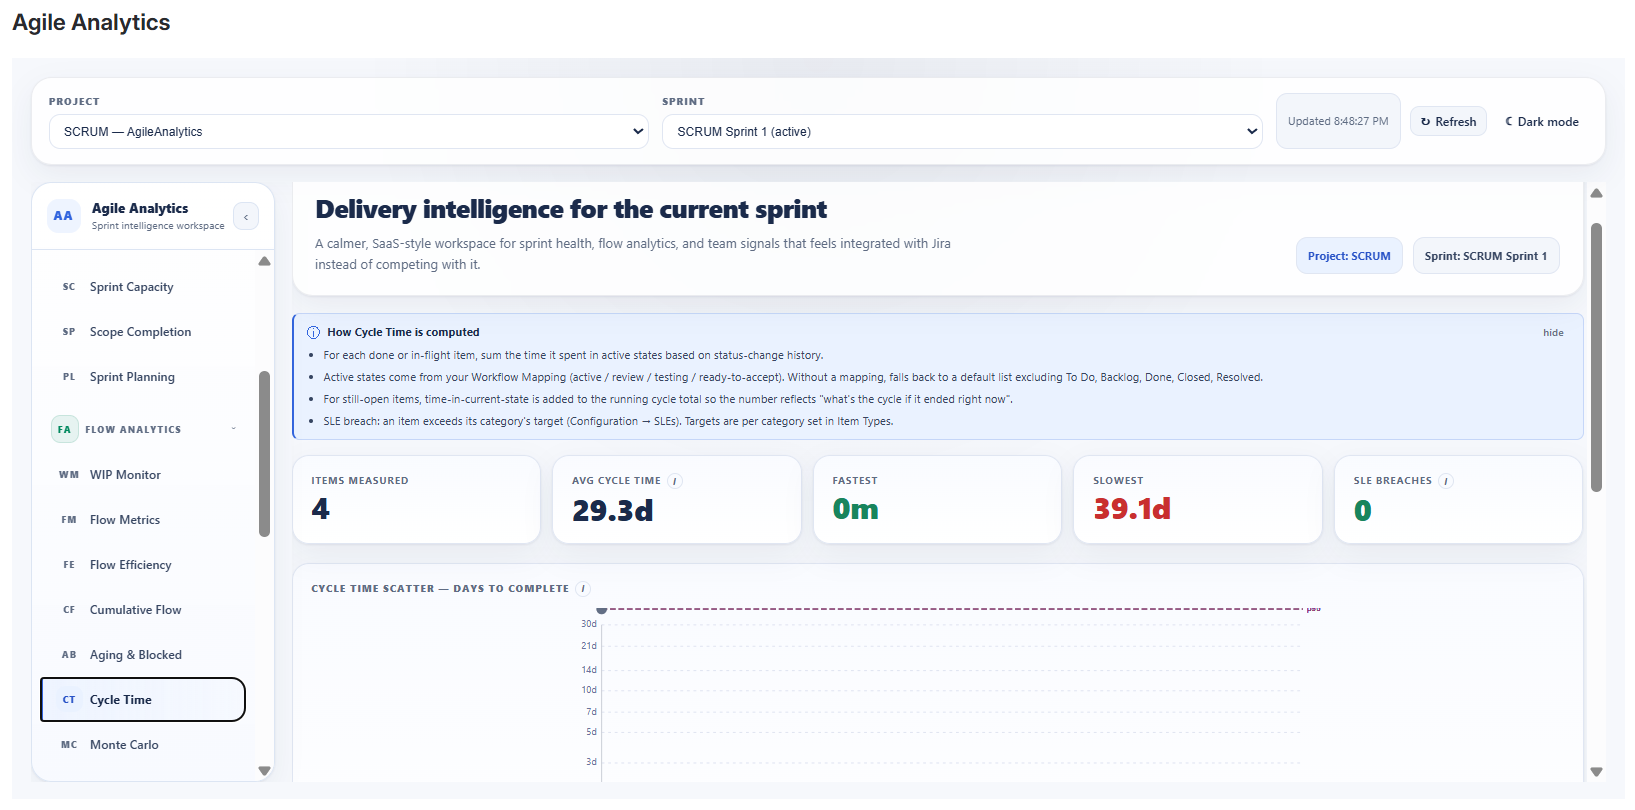
Cycle Time with p50–p85 percentile reference lines and a sortable table to drill into individual items.
Dark theme workspace with integrated Jira styling for teams that live in darker environments.
Features
30+ views organized by the people who actually use them
From sprint health to flow analytics and coaching, each area is structured for a clear operational job-to-be-done.
for Scrum Masters & Team Leads
Sprint Health
- Dashboard — Team Health composite score, completion %, WIP count, days left, Monte Carlo forecast, and role-based playbook
- Burndown Chart — remaining work tracked against ideal pace with trend and pace signals
- Live Stats — done/in-progress/to-do counts, story points, team matrix, and flagged item alerts
- Delivery Signals — throughput, sprint reliability, carryover risk, avg cycle time, flow efficiency, blocked items, and unassigned work
- Sprint Summary — sprint goal, dates, item counts, points, priority mix, and type breakdowns
- Sprint Capacity — committed-points vs assignee capacity with per-person breakdown
- Scope Completion — committed vs added vs completed scope tracking per sprint
- Sprint Planning — Monte Carlo forecast, capacity slider, and cycle-time signals for next-sprint commitment
for Engineering Managers
Flow Analytics
- WIP Monitor — lane-based utilization cards with configurable limits and health badges
- Flow Metrics — daily throughput sparkline, rolling average, status distribution, and flow efficiency
- Flow Efficiency — active time vs wait time breakdown per sprint
- Cumulative Flow Diagram — stacked-area chart with snapshot data table
- Aging & Blocked — lane grid with days in current status, stage history chips, and age buckets
- Cycle Time — log-scale scatter plot with percentile references and sortable table
- Cycle Scatter — per-item cycle time scatter with sortable drill-down
- Cycle Density (Heat Map) — distribution of cycle times across recent sprints
- SLE Status — per-category cycle-time breach roll-up for the active sprint
- Monte Carlo Forecasting — 10,000-run simulations with p50 to p85 confidence ranges and velocity history
- Process Behavior (Wheeler XmR / SPC) — separates routine variation from genuine process signals
for Delivery Leads
Portfolio
- Team Leaderboard — medal cards and ranked table by throughput, active work, story points, and completion rate
- Feature Analytics — epic-level sprint tracking, progress bars, status, completion rate, and unepiced item visibility
for Coaches & Consultants
Agile Coach
- Agile Report — rule-based coaching signals for health flags, WIP issues, stalled work, and velocity trends
- User Metrics — per-contributor done/active/to-do counts, points, issue mix, and flagged work
for operations and retrospectives
Tools
- Retro Snapshot — pre-built retrospective summary with what went well, what could improve, and copy-ready text
- Reporting — exportable CSV reports for sprint health, cycle time, and flow metrics
- Org Hygiene — items needing attention: missing story points, no assignee, stale work
- Audit Trail — chronological configuration log with action, detail, user, and timestamp
- Configuration — workflow mapping, custom fields, WIP rules, SLEs, Sprint Alerts, and notification webhooks
for org-wide visibility and proactive alerts
Pro tier
- Team Health (Baytek) widget — composite sprint-health score card you can pin to any Jira dashboard
- Cycle Time (Baytek) widget — p50 / p85 cycle time over the last six sprints
- Throughput (Baytek) widget — items completed per sprint over the last six sprints
- Sprint Alerts — hourly background trigger that fires Slack and Microsoft Teams notifications when items stall, sprints near completion, or SLE breaches are detected
How it works
Get from install to insight in minutes
Install from Marketplace
One-click install. No API keys, no webhooks, and no complicated admin setup to get started.
Select your project & sprint
Choose any Scrum or Kanban project. Sprint and board data load automatically from Jira Cloud.
Get instant insights
Use 30+ analytics views with real-time data, inline SVG charts, and exportable reports right away.
Technical specs
Trust-building details for Jira admins and platform teams
Pricing
Free tier + 30-day Pro trial
Every analytics view is free for every Jira Cloud install. Pro adds three Jira dashboard widgets and Sprint Alerts. Pro starts with an automatic 30-day evaluation through Atlassian Marketplace; after that, per-user pricing scales with your Jira Cloud user count.
- Free: all 30+ analytics views and Configuration tools
- Pro:Team Health / Cycle Time / Throughput dashboard widgets + Sprint Alerts (Slack & Teams)
- Trial: 30 days automatic on install, billed via Atlassian Marketplace
Ready to bring delivery intelligence into Jira?
Install from Atlassian Marketplace, choose your project and sprint, and start using real sprint and flow analytics immediately.
Support: support@baytekdev.com • Baytek Software © 2026