GitHub Copilot analytics for Azure DevOps teams
Keep one consistent product story across your site, then split the experience by platform. Azure DevOps stays as the live default, while Jira now has a matching dedicated path ready for its final content.
Choose your platform
One product family, two tailored landing paths
The visual system stays consistent with your current site, while each platform gets its own copy, imagery, and CTA direction.
Azure DevOps
Current production experience
The Azure DevOps edition is the default path today, with live demo content, current screenshots, and the full ROI story already in place.
- ADO-focused messaging and visuals
- Executive ROI, team adoption, and user insights
- Live demo and install CTA already connected
Jira
Matching route ready for final content
The Jira edition now has a dedicated path and matching UI shell so you can add the final Jira-specific story, screenshots, and CTAs next.
- Separate destination for Jira buyers
- Same dark purple brand system and layout
- Ready for Jira copy and screenshots once finalized
Why Copilot AI Metrics?
GitHub's built-in dashboard shows you totals. We show you what's actually happening.
GitHub Copilot's native dashboard gives you org-level suggestion counts. That's a start — but it doesn't tell you which teams are genuinely adopting AI, which developers are getting the most value, or whether your seat spend is actually paying off. Copilot AI Metrics is built for engineering leaders who need answers, not just numbers.
Features
Everything engineering leaders need
Six purpose-built views that answer the questions your CTO and engineering managers are already asking.
Executive Dashboard
A single-screen command center for your entire Copilot rollout. See total users, active users, acceptance rate, suggestions accepted, lines of code saved, and seat cost — all at a glance. Trend charts show daily usage from your first deployment to today.
- Key metrics at a glance
- Adoption funnel visualization
- Daily usage trend chart
- Seat cost and ROI summary
Team-Level Analytics
Break down Copilot usage by team so you know exactly which groups are leading adoption and which need enablement support. Compare teams side by side before the conversation becomes a leadership issue.
- Per-team acceptance rates and suggestion counts
- Team overview table with member drill-down
- Cost per team modeling
- Last active tracking per member
Individual Contributor Insights
Rank every developer by acceptance rate, suggestions accepted, lines saved, and usage streak. Identify your Copilot power users and understand what habits drive higher acceptance rates across your org.
- Per-user leaderboard (acceptance rate, lines saved, streaks)
- Top performers by category
- Streak duration tracking
- Individual usage history table
Trend Analysis
Visualize how Copilot adoption and effectiveness evolve over time. Filter by date range, team, or language to isolate exactly where AI is generating the most value in your stack. Watch acceptance rates improve as developers build AI-native habits.
- Suggestions accepted over time
- Acceptance rate trend line
- Language and model coverage breakdown
- Configurable date range filters
AI-Generated Executive Summary
Stop writing Copilot ROI reports by hand. The built-in executive summary auto-generates top insights from your usage data — ready to paste into a leadership update or quarterly business review.
- Auto-synthesized top insights
- Engagement breakdown by segment
- Time and language service coverage
- Exportable summary view
Cost Modeling & ROI
Translate raw seat spend into productivity ROI. See estimated cost savings based on lines of code saved, and identify underutilized licenses before renewal.
- Monthly cost vs. productivity value
- Underutilized seat detection
- Per-team cost breakdown
- ROI trend over deployment lifetime
Screenshots
The dashboard in action
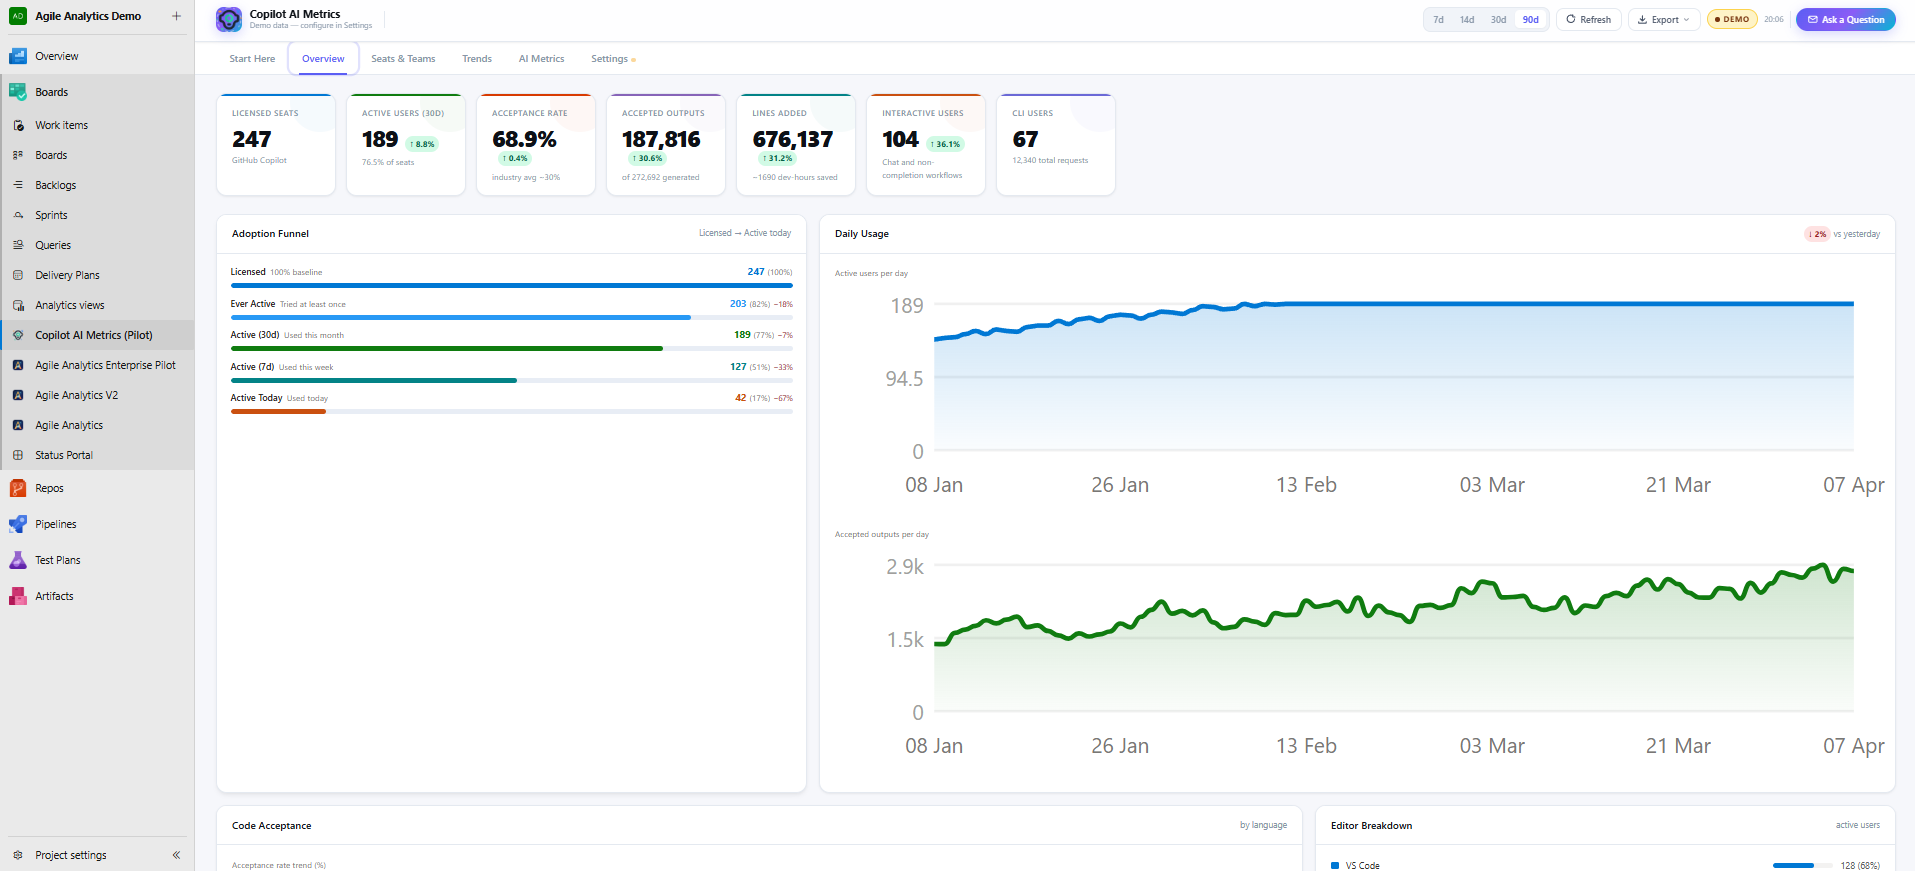
Executive Dashboard — KPI cards, adoption funnel, daily usage charts, and ROI summary.
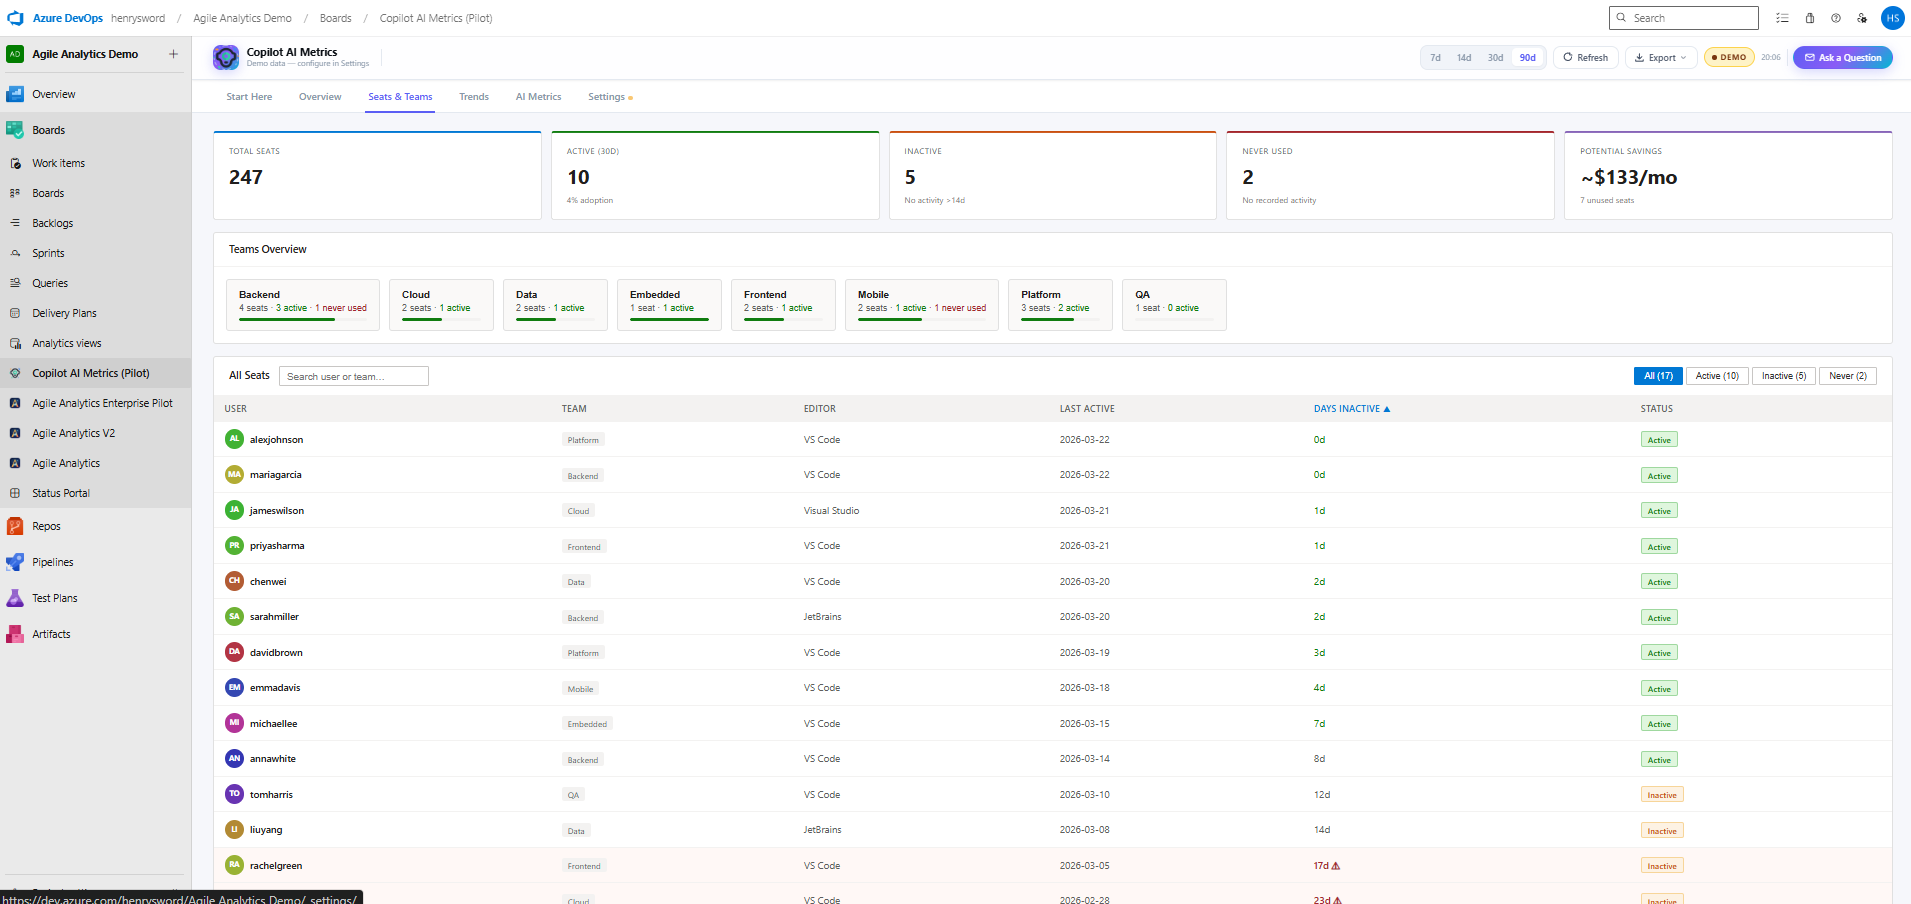
Team Analytics — per-team acceptance rates, member drill-down, and cost modeling.
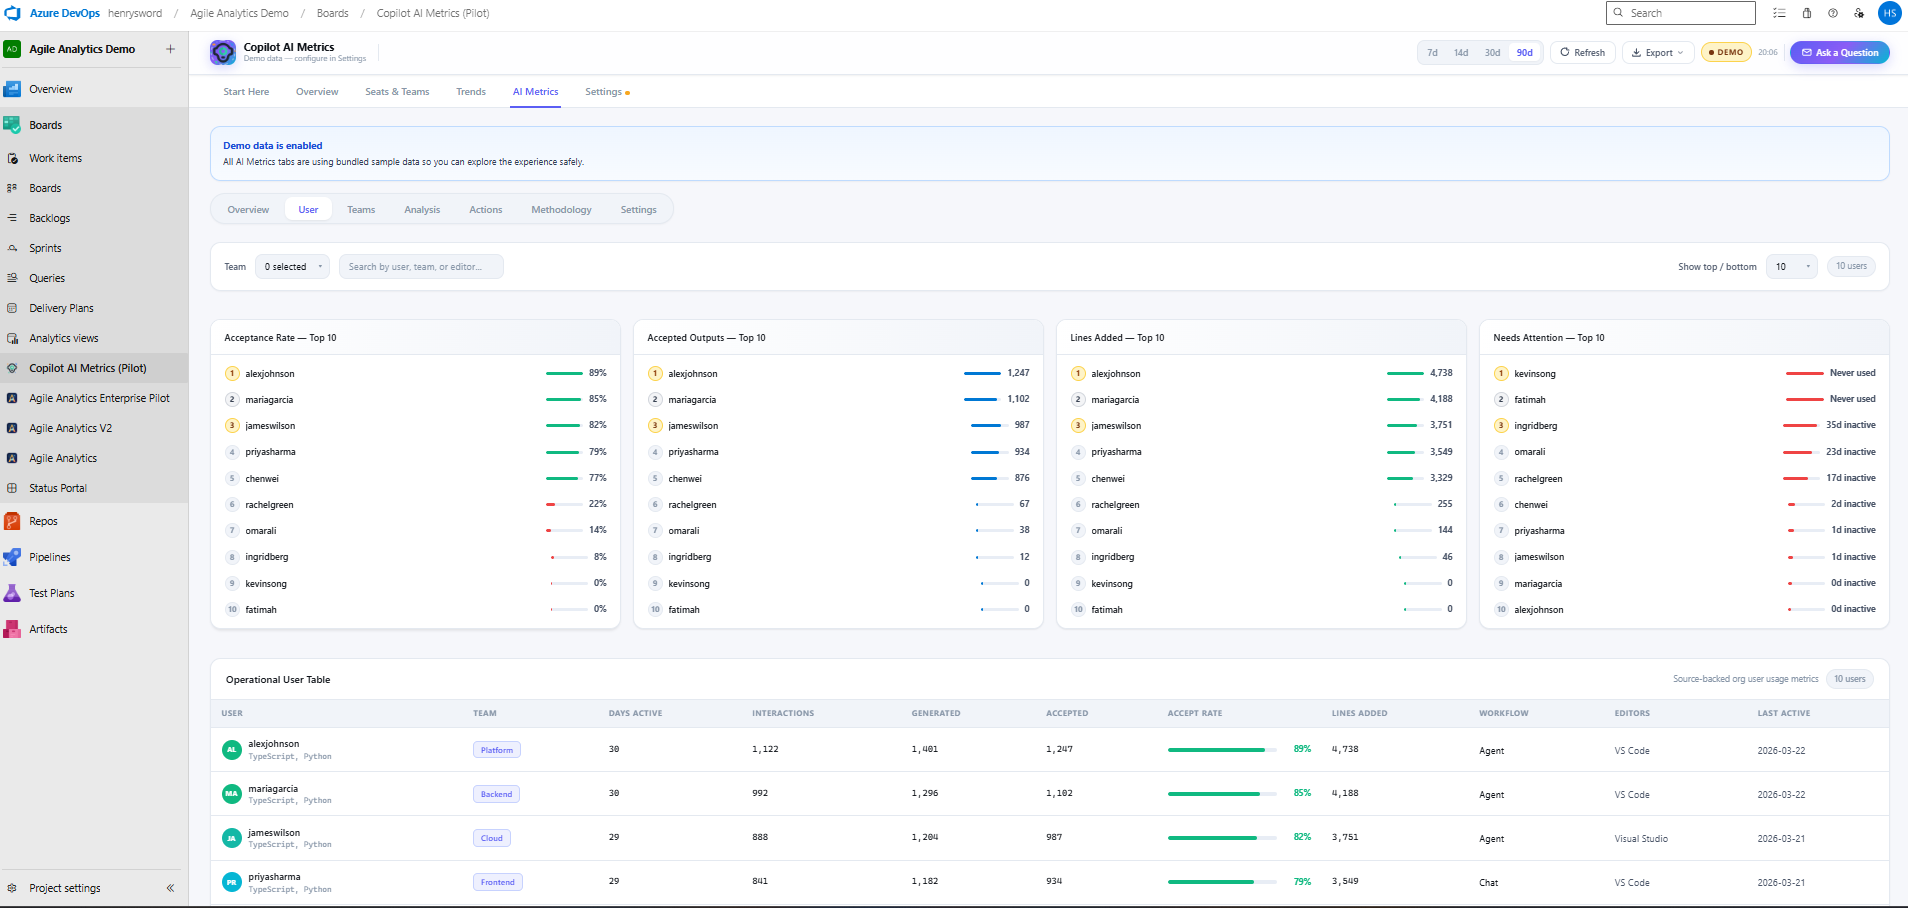
Individual Insights — developer leaderboard ranked by acceptance rate, lines saved, and usage streaks.
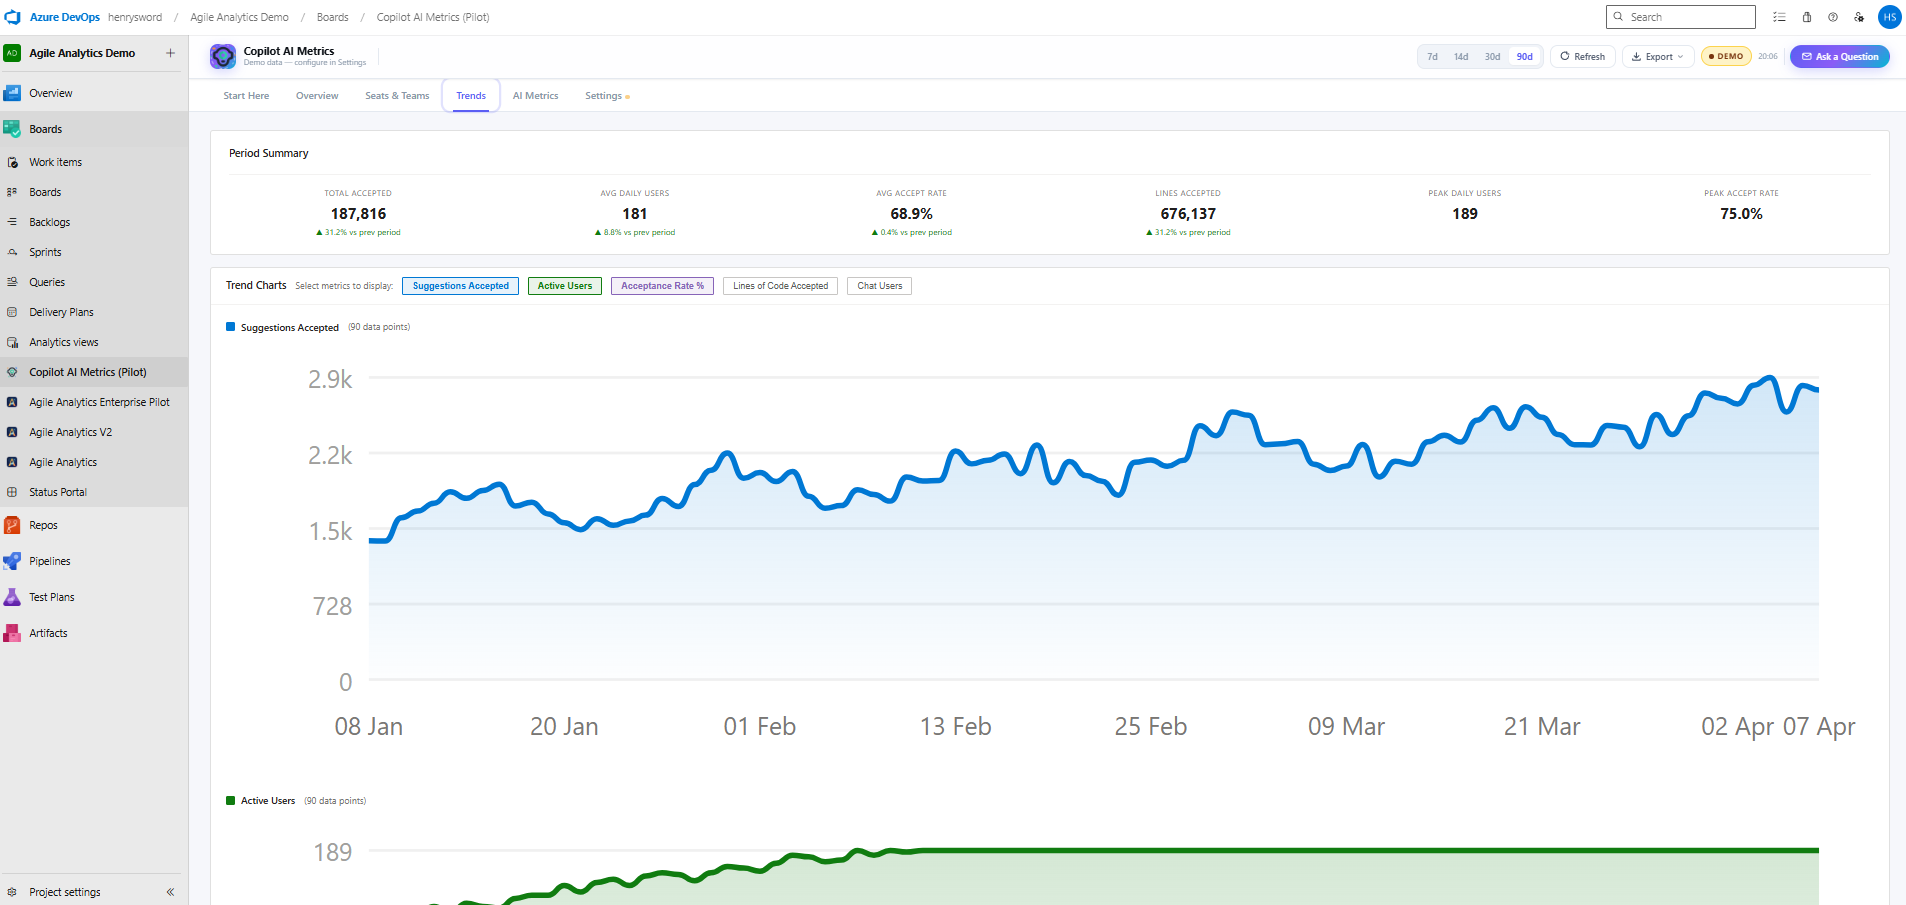
Trend Analysis — configurable date range with language and model coverage breakdown.
Quick Start
Up and running in minutes
No data pipelines to build. No infrastructure to manage. Just install and connect.
Connect your GitHub Org
Link your GitHub organization through the settings panel. Copilot AI Metrics pulls data directly from the GitHub Copilot Metrics API — no data pipelines to build.
Configure your teams
Map GitHub teams to your org structure. Set display preferences, user connections, and workspace settings in the built-in configuration UI.
Start measuring
Your dashboard populates immediately with historical data. Share views with engineering managers and leadership without any additional setup.
Start with Azure DevOps today — add Jira next
The Azure DevOps journey is live right now, and the Jira landing path is already set up to receive its final platform-specific content.
Want the AI governance side? Read how AI Metrics & AIIP work in Agile Analytics 4.0 →