See exactly how your team uses GitHub Copilot
Real-time adoption metrics, acceptance rates, seat efficiency, ROI, and team leaderboards — all inside Azure DevOps. No backend. No subscription. No data ever leaves your browser.
Free forever · Works in minutes · Zero configuration required
Screenshots
The dashboard in action
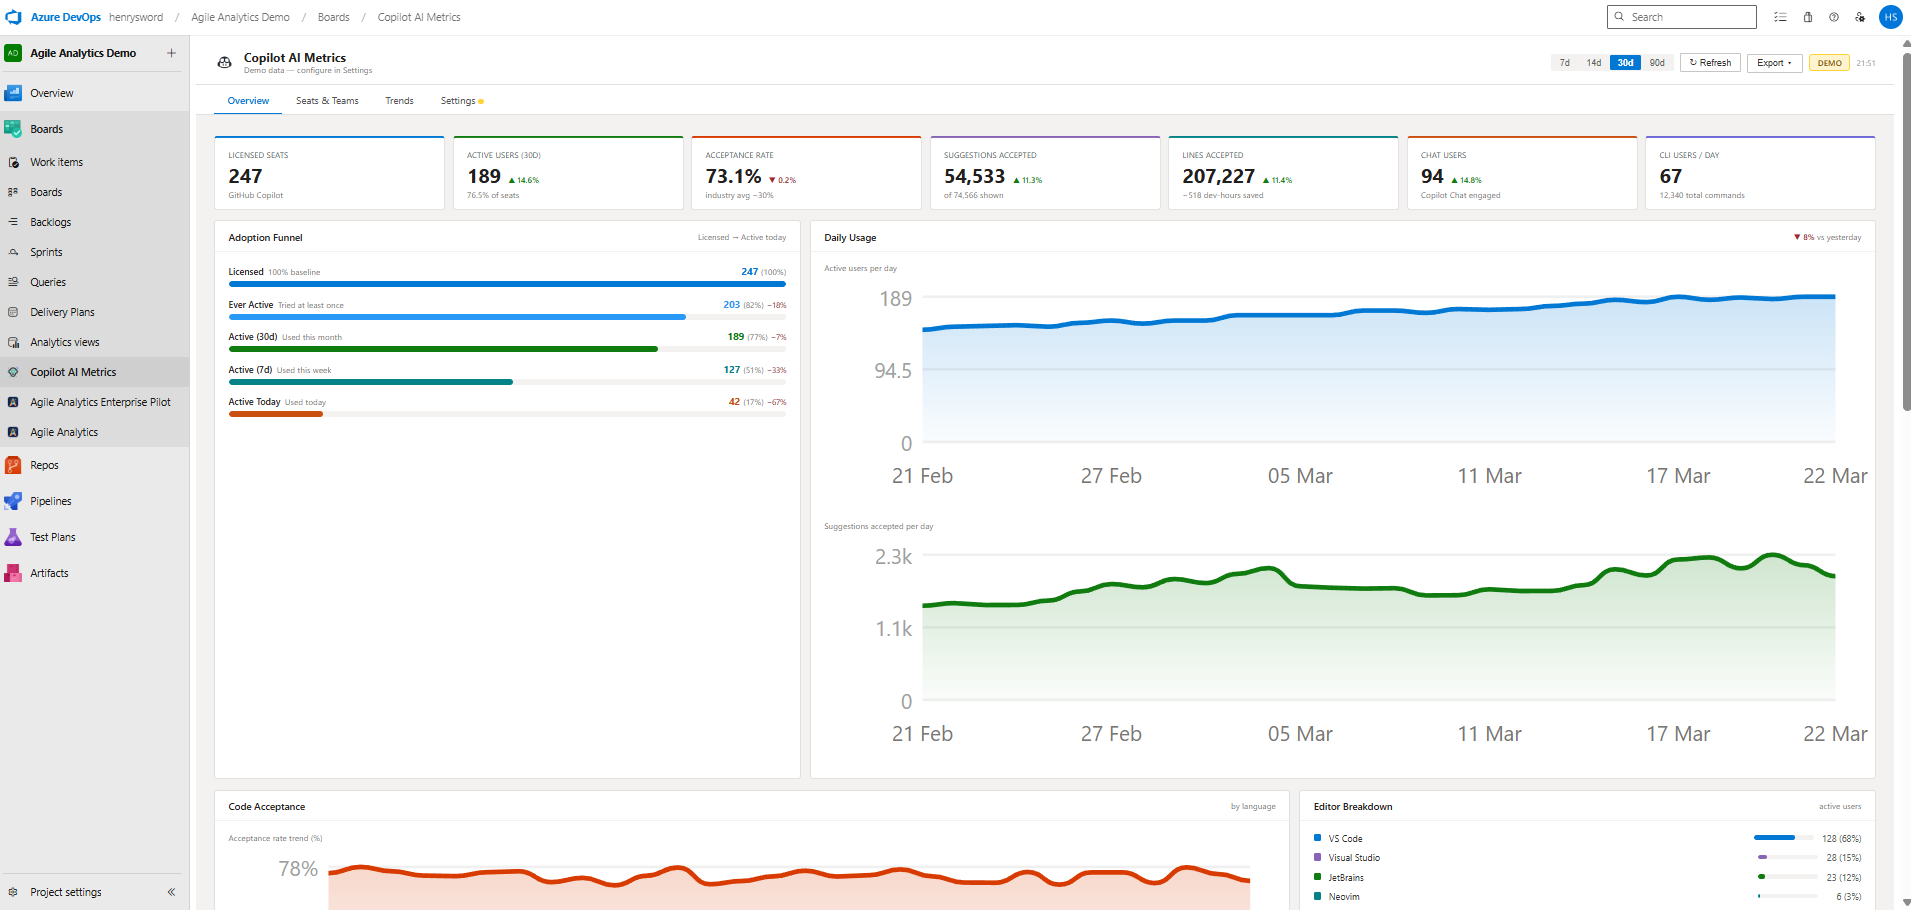
Overview Dashboard — 7 KPI cards, adoption funnel, daily usage charts, code acceptance by language, editor breakdown, and ROI panel.
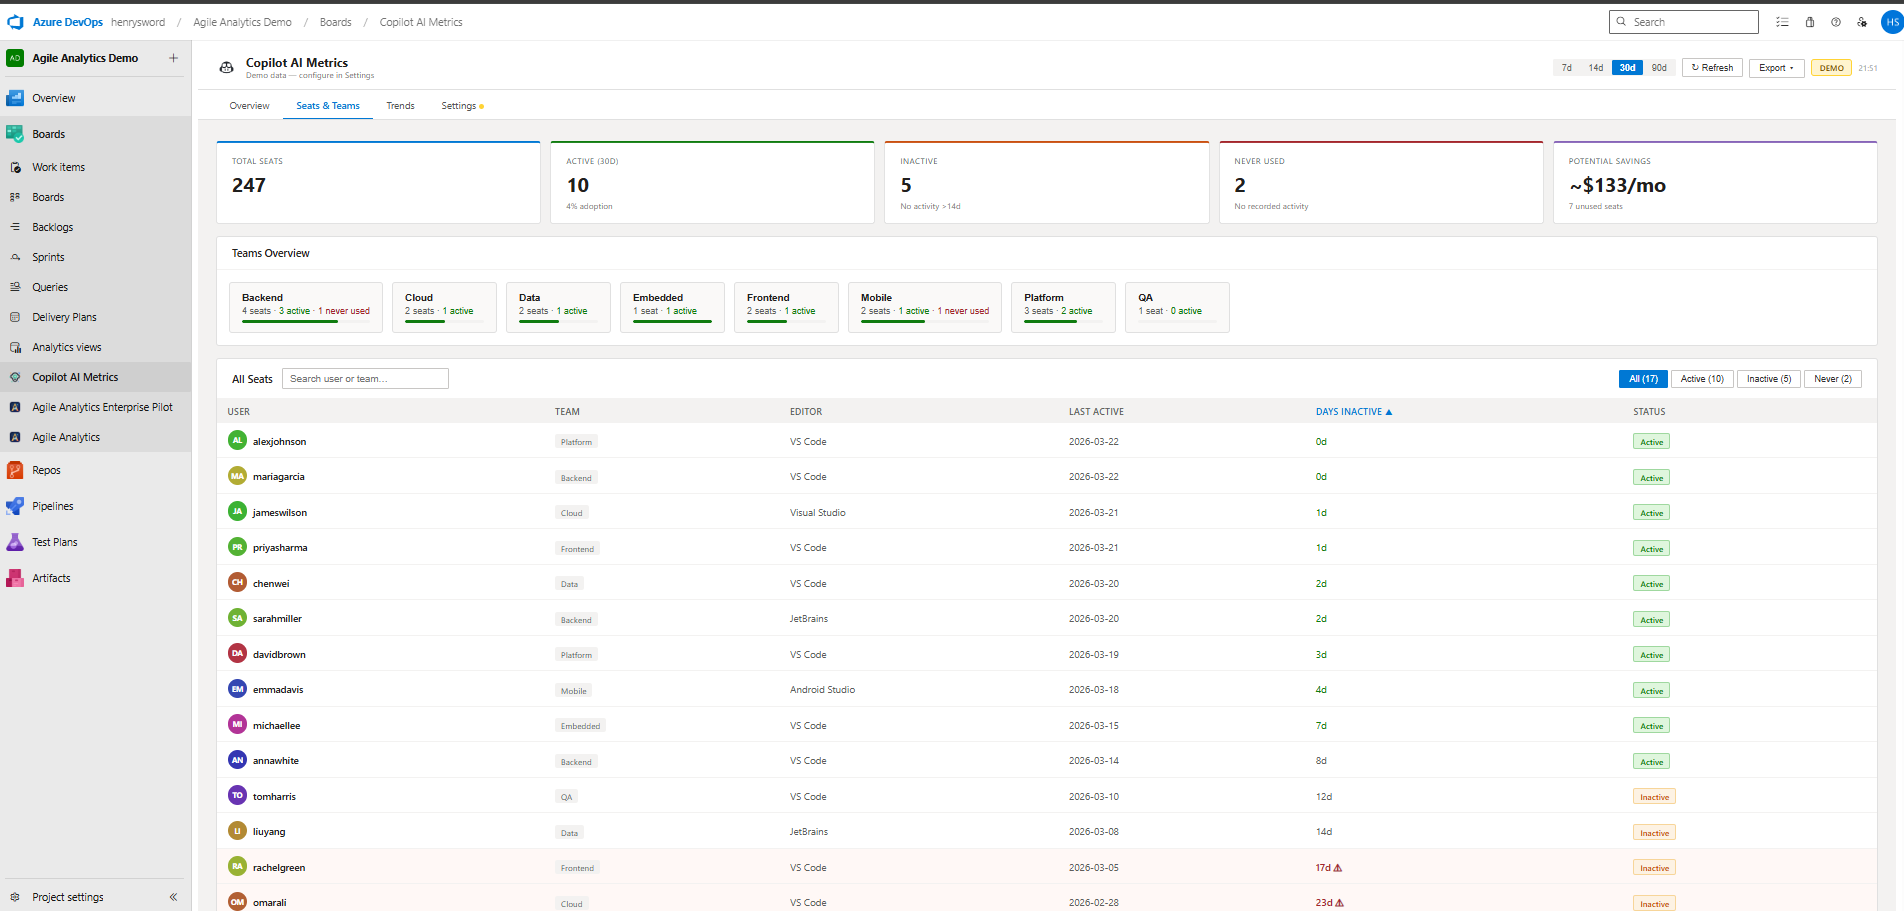
Seats & Teams View — per-team adoption summary with seat table sorted by last activity and inactivity status badges.
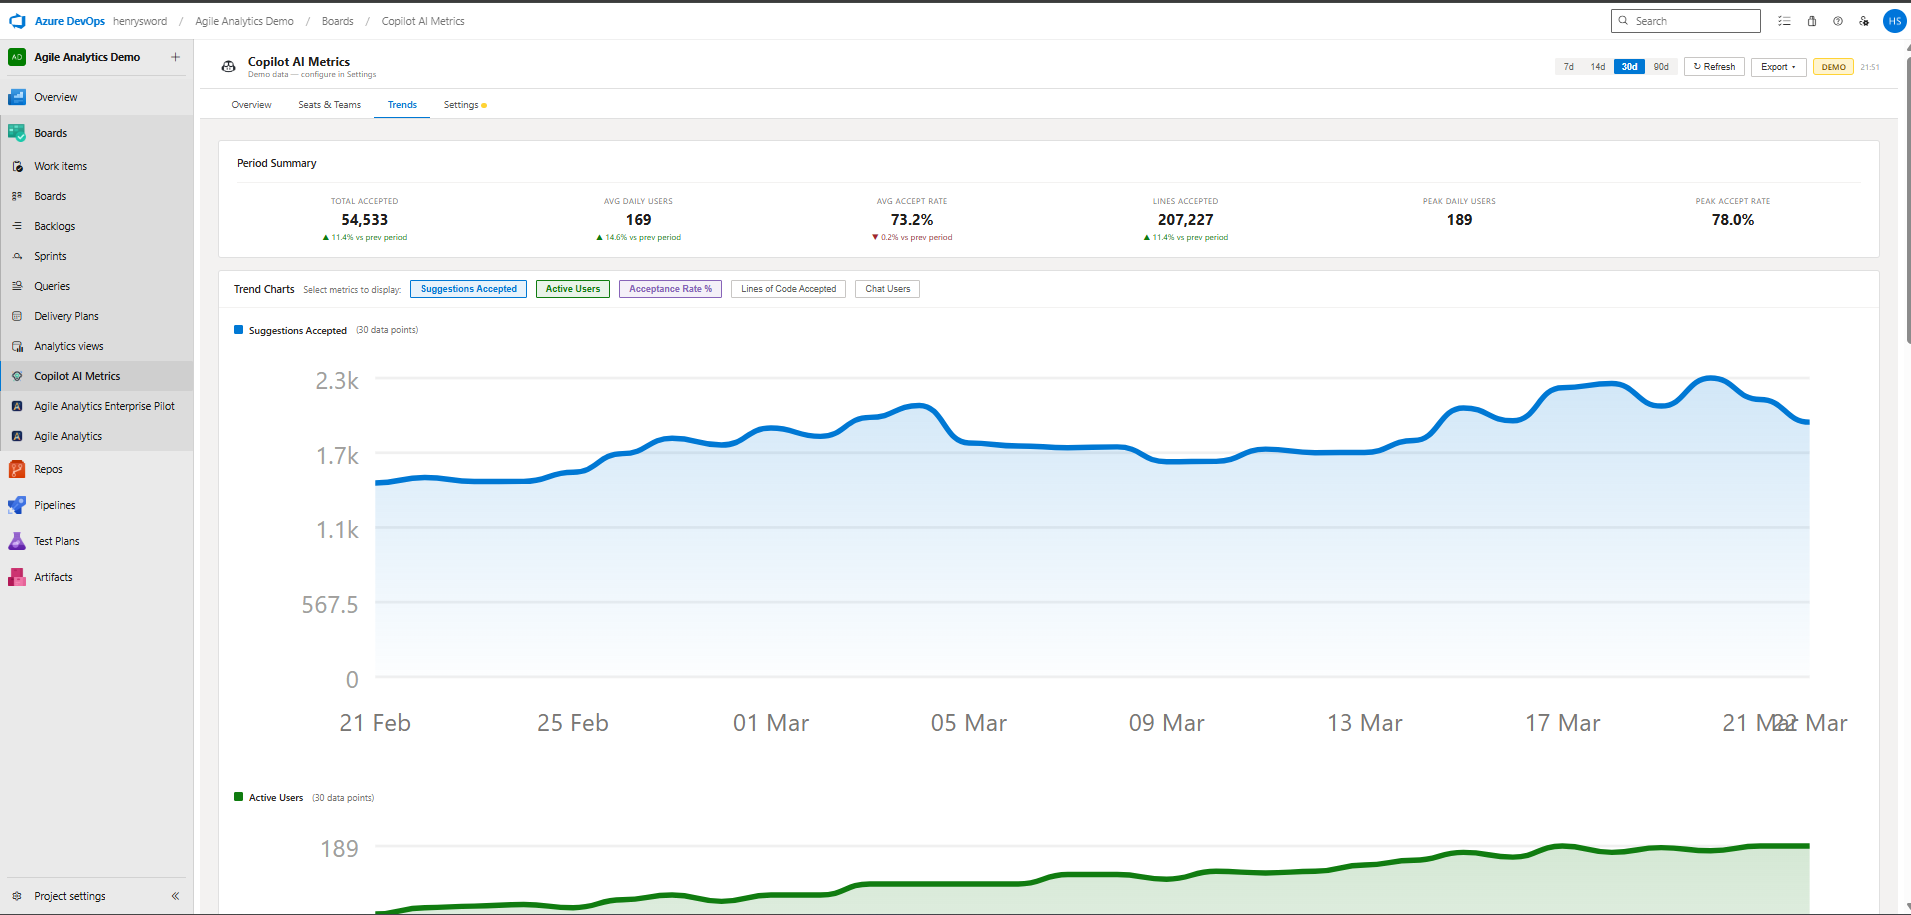
Trends View — multi-series line charts, period-over-period % delta summary, and full daily data table.
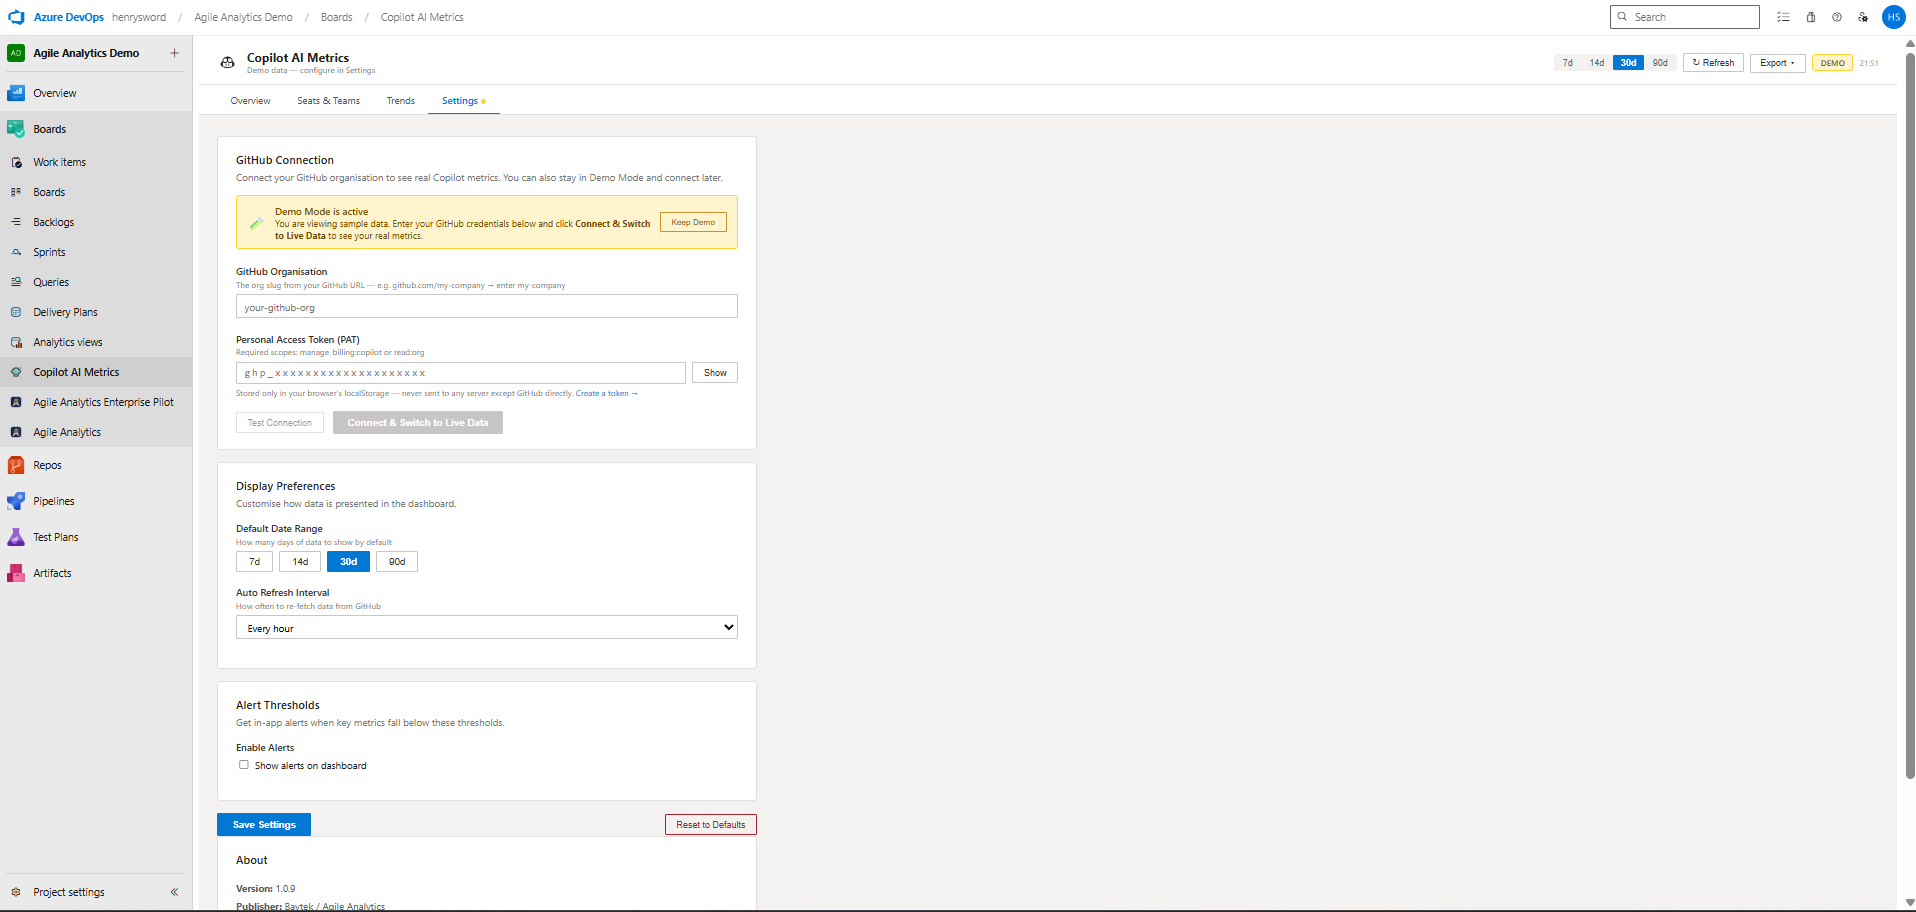
Settings & Setup Wizard — connect your GitHub organisation, configure alert thresholds, and manage display preferences.
Features
Everything you need to understand Copilot ROI
Built for engineering leaders, product managers, and developers who want real answers — not just raw GitHub API data.
Overview Dashboard
7 live KPI cards with period-over-period delta arrows — licensed seats, active users, acceptance rate, suggestions, lines accepted, chat users, and CLI users.
Adoption Funnel
Visualise the drop-off from Licensed → Ever Active → Active This Month → Active This Week → Active Today. Spot where adoption stalls instantly.
Daily Usage Charts
Smooth area charts for active users and suggestions per day with hover tooltips. See trends at a glance and identify spikes or dips.
Code Acceptance
Acceptance rate trend over time with a full breakdown by language — TypeScript, Python, C#, JavaScript, Go, and more.
ROI & Value Panel
Developer hours saved, estimated value generated ($), cost per active seat, and ROI multiple vs licence cost. Justify Copilot to leadership in seconds.
Top & Bottom Users
Toggle between your top 10 highest adopters (with gold/silver/bronze medals) and the 10 users who need coaching — with inactivity warnings.
Seats & Teams View
Per-team adoption summary tiles, full seat table sortable by user, team, last activity, or days inactive. Status badges: Active / Inactive / Never Used.
Trends View
Selectable multi-series line charts across any metric. Period summary with % delta (second half vs first half). Full daily data table included.
Chat Insights
Total conversations, code insertions, copy events, daily chat users, and outcome funnel. Understand how developers are using Copilot Chat in depth.
CLI Usage
Volume and trend for gh copilot explain, gh copilot suggest, and gh copilot test — broken out per command with daily charts.
Editor Breakdown
See which editors (VS Code, Visual Studio, JetBrains, Neovim) your team uses with Copilot, by active user count.
Alert Thresholds
Configurable banners for low acceptance rates, low adoption, and inactive seats. Dismiss individually. Set your own thresholds in Settings.
Privacy & Security
Your data never leaves your browser
PAT stored locally only
Your GitHub Personal Access Token is saved in browser localStorage — never transmitted to Baytek or any third party.
Direct API calls
All requests go browser → api.github.com directly. No intermediate server. No proxy. No cloud function.
Zero telemetry
Baytek collects absolutely no usage data from this extension. Not even page views. Nothing.
One-click reset
Settings → Reset to Defaults removes your token and all stored preferences from the browser instantly.
Quick Start
Up and running in 3 minutes
No server to configure. No subscription to manage. Just install and connect.
Install from the Azure DevOps Marketplace
Search "Copilot AI Metrics" or click Install below. The extension appears under Boards → Copilot AI Metrics in any project.
Run the Setup Wizard
A guided 4-step wizard walks you through entering your GitHub organisation slug and creating a Personal Access Token with the right scopes (manage_billing:copilot or read:org).
Test Connection → Go to Dashboard
Hit Test Connection. The wizard validates your token, confirms your seat count, and one-click switches you to live data. Done.
Or explore with Demo Data first
Not ready to connect? Click "Explore with Demo Data" from the wizard to see every feature with realistic sample metrics — no GitHub account required.
Requires GitHub Copilot Business or Enterprise licence · Free forever
Want the complete engineering analytics picture?
Copilot AI Metrics covers AI adoption. Agile Analytics by Baytek adds sprint velocity, work item analytics, team throughput, burndown charts, cycle time, and custom cross-team dashboards — all inside Azure DevOps, no backend required.