A single Azure DevOps dashboard for sprint, flow, and delivery metrics
Buyers searching for an Azure DevOps dashboard usually want one place to see sprint health, throughput, cycle time, and forecast confidence — without leaving ADO. Agile Analytics adds a delivery-focused dashboard inside Azure DevOps so leads, managers, and stakeholders share the same view.
Why buyers search for this
- Azure DevOps Boards has charts, but no unified dashboard that ties sprint, flow, and forecasting together
- Power BI dashboards take weeks to design, model, and maintain before delivering value
- Stakeholders ask for status updates that engineering teams have to assemble manually each week
What this page should help them do
- Open one Azure DevOps dashboard that shows sprint health, cycle time, throughput, WIP pressure, and forecast ranges
- Skip the Power BI build — every chart is wired to your boards out of the box
- Give leadership a stable, weekly-relevant dashboard instead of ad-hoc spreadsheets
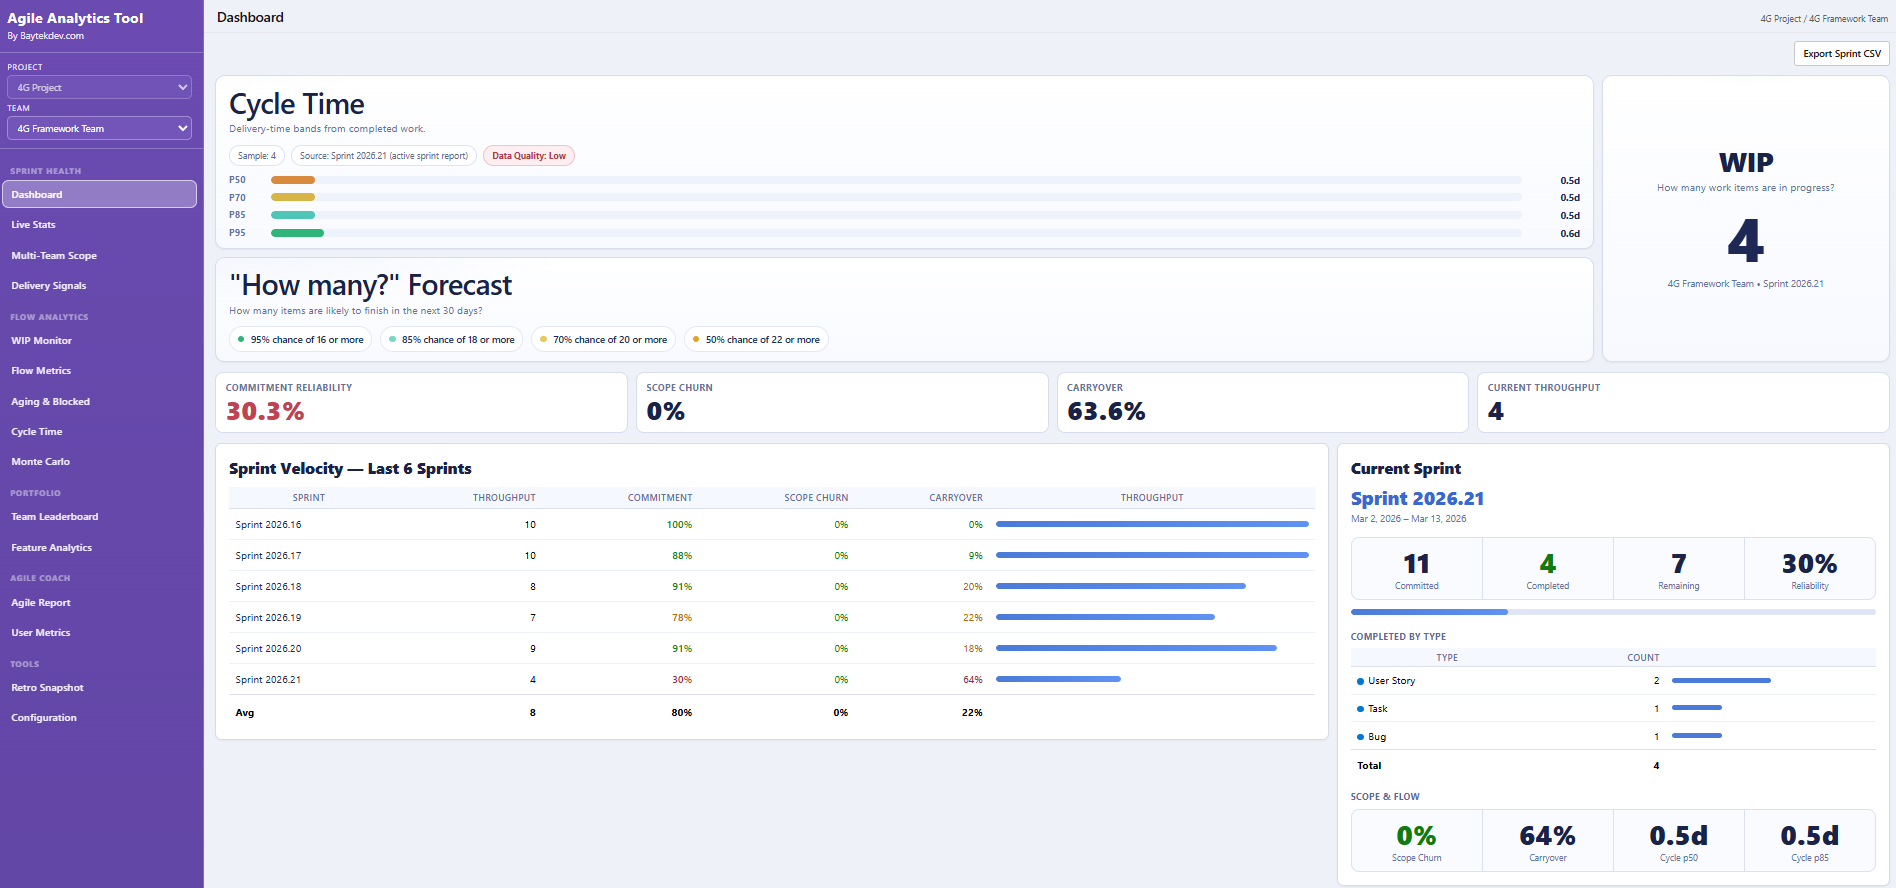
What sits on the Azure DevOps dashboard
The Agile Analytics Azure DevOps dashboard is one connected view that ties together the four questions a delivery lead asks every week: is this sprint on track, how is flow trending, when are we likely to finish, and what is silently going wrong. Sprint health covers commitment vs completed story points, burndown with the original commitment line, and a sprint summary tile that exposes scope additions instead of hiding them. Flow analytics adds a cycle-time scatterplot with P50/P85 percentile lines, throughput by item type, and a Flow Efficiency view that splits active work time from queue time. Forecasting runs a Monte Carlo simulation against your last six sprints of throughput so you can give a confidence range for the next milestone, not a single optimistic date. Operational views — WIP monitoring, aging work, blocked-item detection — round out the dashboard with the early-warning signals that usually surface in a sprint retrospective a week too late.
Why a single Azure DevOps dashboard usually beats a Power BI rebuild
Most teams who arrive at this page have already considered building the same dashboard in Power BI. The trade-off comes down to time-to-first-chart and ongoing maintenance. A Power BI rebuild needs a dataset connector, a semantic model that mirrors your work-item types and states, DAX measures for cycle time and throughput, refresh schedules, and a workspace permission strategy — usually six to ten weeks before the first stakeholder sees a chart. The Azure DevOps dashboard in Agile Analytics ships those views pre-wired and rendered inside Azure DevOps, so the first chart is live in minutes after install. There is no separate workspace to log into, no exported dataset, and no publisher-hosted analytics backend — every chart reads your Boards data live through the standard Azure DevOps extension surface. When your process changes (new state, new team, new work-item type), the dashboard follows automatically because it joins on the same Azure DevOps schema your team already maintains.
Rolling the Azure DevOps dashboard out across multiple teams
Once one team has the dashboard pinned, the second and third teams are almost free to onboard. Every team inside the same Azure DevOps organisation inherits the same install, so there is no per-team setup, no per-team licence assignment, and no per-team data pipeline to wire up. Each team can scope the dashboard to its own area path, iteration, or filter set without affecting other teams, so the Scrum team and the Kanban team next door each see only their own work even though both use the same underlying extension. For organisations rolling the dashboard out beyond engineering — to a PMO, a delivery committee, or executive stakeholders — viewers do not need a paid Azure DevOps Basic licence; an Azure DevOps Stakeholder licence is enough to see the dashboard. Combined with per-seat pricing that only counts users who actually open the analytics hub, this makes the cost curve flat as adoption widens.
What every Azure DevOps dashboard widget should show
The evergreen widget guide — sprint summary, velocity, burndown with commitment line, cycle time scatterplot, throughput, and flow signals.
Open page →Azure DevOps dashboard widgets
The widget catalog that pins these views to any Azure DevOps dashboard page alongside your existing tiles.
Open page →Browse all dashboards
Sprint, flow, forecasting, and configuration views — see every dashboard the extension ships with.
Open page →View pricing
Plans from $25/mo. Premium ($2,000/yr) covers an unlimited number of viewers across your Azure DevOps organisation.
Open page →Questions buyers usually ask next
How is this different from the built-in Azure DevOps dashboard?
The built-in dashboard surfaces work item queries and a few charts but does not provide flow analytics, percentile-based cycle time, Monte Carlo forecasting, or sprint commitment views. Agile Analytics adds those as a connected dashboard experience.
Can the dashboard be embedded in our existing Azure DevOps dashboard page?
Yes. The extension ships dashboard widgets that you can pin to any Azure DevOps dashboard so you can keep your current dashboard layout and add the analytics views alongside.
Does it require a separate database or hosting?
No. There is no publisher-hosted analytics backend for the standard analytics workflow. Dashboards run inside Azure DevOps using your existing data.