Monte Carlo forecasting for Azure DevOps delivery planning
Delivery leaders searching for Azure DevOps Monte Carlo forecasting usually have one urgent question: when are we likely to finish? Agile Analytics runs a 10,000-trial bootstrap simulation against your own finished-sprint throughput, directly inside Azure DevOps, and returns a probability range instead of a single guess.
Why single-date delivery estimates stop being believed
- Stakeholders want a delivery date, but a single-point estimate only survives until it is wrong once
- Average velocity planning smooths away the sprint-to-sprint variation that actually decides whether a date slips
- Forecasting usually means exporting throughput history into a spreadsheet or a separate BI tool before anyone can see a range
What Monte Carlo forecasting in Azure DevOps tells you
- Run a 10,000-trial bootstrap simulation against your own finished-sprint throughput, right where the backlog already lives
- Read P50, P70, P85, and P95 as an honest range instead of a single promised date
- Ask either question the business actually asks: how many items by this date, or when will these N items be done
How the Monte Carlo simulation actually works
This is a bootstrap resample of your own history, not a statistical curve fit. For each of 10,000 trials, the simulation walks forward through the forecast window and, at every step, draws one of your team’s own finished sprints at random (with replacement), then adds that sprint’s completed-item count to the running total. Do that 10,000 times and the spread of outcomes becomes the forecast. It runs on the Azure DevOps history the extension already reads, without exporting your data to another platform first, without a personal access token to configure, and without a publisher-hosted analytics backend in between. The simulation is also deterministic: the random draws are seeded from your sprint history, the forecast window, and the trial count, so running it twice against the same inputs returns the same P50/P70/P85/P95 range both times. The range only moves when your underlying throughput changes. If the forecast window’s final stretch does not land on a clean sprint boundary, that trailing partial period is prorated rather than counted as a full sprint, so the model does not overcount near the edges.
Reading percentile forecasts, and why a range beats a single date
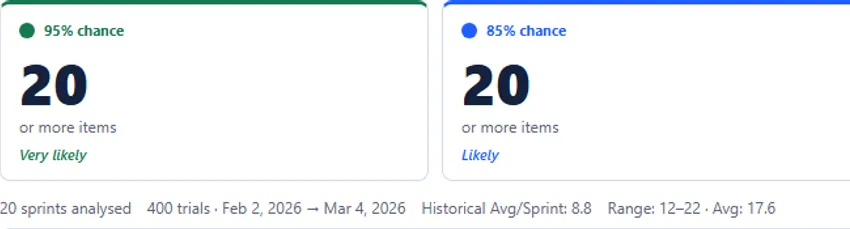
Every forecast comes back as four confidence levels read off the same 10,000 simulated runs, each meaning "this many items or more, at least this often":
- P95, Very likely: the number you are 95% likely to reach or beat. Usually the smallest, safest commitment in the range.
- P85, Likely: the level most teams use for a date they are willing to put in front of a stakeholder.
- P70, Probable: a workable middle ground, right more often than not but not a safe promise.
- P50, Coin flip: the number half the simulated runs reached and half did not. Useful as a stretch target, risky as a commitment.
How many by a date, versus when will N items be done
These are two different questions, and the simulation runs a separate mode for each. "How many?" takes a target date (30 days out by default) and returns how many backlog items you are likely to finish by then, at each confidence level; use it when the date is fixed and the open question is scope, for example a release date or a contractual milestone. "When will it finish?" takes a backlog size, such as the remaining items in an epic, and returns a date range instead; use it when the scope is fixed and the open question is the date. Because the direction of the question flips, so does the percentile: for "when will it finish?", P50 is the earliest, most optimistic date, and P95 is the latest, most conservative one. When a backlog is large enough that some of the 10,000 simulated runs do not reach the target count within the forecast horizon, the tool reports the percentage that did not finish instead of quietly assuming every run completed, so a wide date range is not papered over with a falsely confident number.
What the forecast needs before the numbers mean anything
A Monte Carlo forecast is only as trustworthy as the finished-sprint history it resamples from. When you open the forecast for a team, the sprint picker lists your ten most recent finished sprints and defaults to selecting the six most recent to run the first forecast; you can pick a different set by hand, which matters if one of those sprints was a genuine outlier, a holiday week or a reorg, that you want out of the resample. The sprint currently in progress is left out of that default selection automatically: resampling from a partial, still-open sprint would drag the whole forecast down with a throughput number that has not finished counting yet. If a sprint you selected fails to load, the view says so ("only X of Y requested sprints loaded") rather than silently forecasting off a smaller sample and calling it complete. A team with only one or two finished sprints will get a forecast, but the range will be wide until more history builds up; the simulation cannot manufacture certainty your team has not earned yet.
See Forecasting features
How the 10,000-run Monte Carlo simulation works, what inputs it needs, and how to read P50/P85/P95 dates with stakeholders.
Open page →Read the Monte Carlo guide
Plain-English walkthrough of why probabilistic forecasting beats single-point estimates and how to introduce it to the business.
Open page →See cycle time analytics
The forecast is only as good as the throughput history behind it. Percentile cycle time shows whether your delivery pace is stable enough to forecast from.
Open page →Compare with ActionableAgile
Evaluating ActionableAgile for Azure DevOps? How the two approaches to Monte Carlo forecasting, flow metrics, and data handling differ, and which fits which team.
Open page →Monte Carlo forecasting questions
Who is Monte Carlo forecasting most useful for?
Engineering managers, PMO leaders, program managers, and delivery leads who need to communicate date confidence instead of a single optimistic forecast.
What makes it better than average velocity planning?
Average velocity hides variability behind one number. The simulation keeps the full spread of your finished-sprint throughput and reports "at least this many, this often" at four confidence levels, which leads to better stakeholder conversations and fewer brittle promises.
Does the forecast change every time I run it?
No. The simulation is seeded from your sprint history, the forecast window, and the trial count, so running it twice against the same inputs returns the same P50/P70/P85/P95 range both times. A forecast that changes on every click is hard to trust in front of a stakeholder; this one holds steady until your underlying sprint data changes.
How much sprint history does it need?
The simulation resamples from your team’s own finished sprints, so more completed sprints produce a tighter range. It automatically drops the sprint currently in progress from the default selection, since a partial sprint would drag the forecast down, and you can hand-pick which finished sprints to include if one was an outlier.
What happens if my backlog is too large to forecast confidently?
In the "when will it finish?" view, if some of the 10,000 simulated runs do not reach the target count within the forecast horizon, the tool reports what percentage did not finish instead of assuming every run completed. That tells you the later dates in the range are a floor, not a promise.