Cycle time and lead time analytics for teams that need to reduce flow delays
If your team is trying to understand why work stays in progress too long, cycle time and lead time analytics are usually the missing layer. Agile Analytics adds percentile-driven visibility into both, cycle time from when work starts and lead time from when it was created, plus aging work signals, directly inside Azure DevOps.
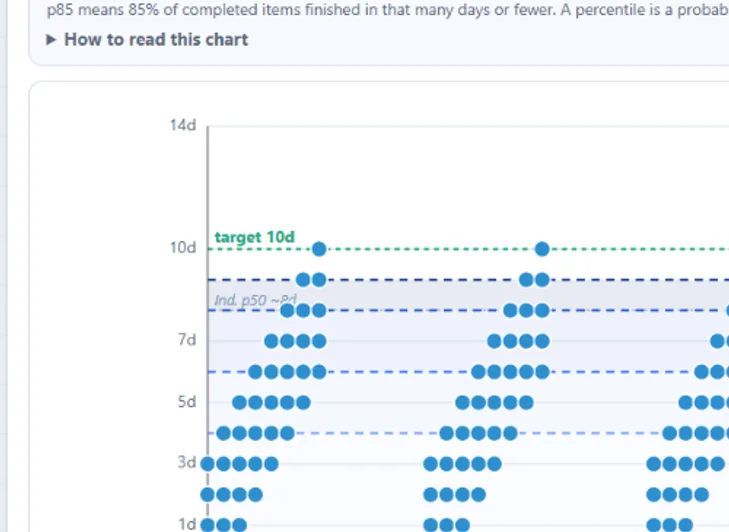
Why cycle time is hard to see in Azure DevOps
- Teams know throughput feels slow but cannot see where variability is increasing
- Outliers and aging work stay hidden until late in the sprint
- Managers need a way to discuss flow efficiency without exporting data to another tool
- Cycle time alone does not show how long work waited before it started, so lead time, the true creation-to-done span, goes unmeasured
What Azure DevOps cycle time analytics shows you
- Track cycle time distribution with percentile lines that support realistic service expectations
- Surface work items that are aging beyond the team’s normal delivery pattern
- Connect cycle time performance to WIP discipline and blocked work
- Switch the same scatterplot to lead time, measured from creation to done, to see how long work waited before it even started
See Flow Analytics features
Cycle time scatterplots, percentile-based service expectations, aging work visibility, and the full flow analytics stack.
Open page →Read the cycle time guide
Why percentile-based cycle time beats averages, and how cycle time pairs with WIP monitoring to reveal real flow problems.
Open page →See WIP monitoring
Cycle time tells you how long work took; WIP tells you why. Per-column pressure, configurable limits, and the aging view that catches blocked items early.
Open page →See how this feeds DORA metrics
The same active-to-done duration this page tracks as cycle time is also the work-item proxy behind lead time for changes in the DORA Metrics view, reported with percentiles and a sample size.
Open page →Cycle time analytics questions
Why are percentile lines useful for cycle time?
They give a more honest operating range than averages. Teams can use percentile-based views to set expectations around how long work usually takes and when an item has become risky.
Is cycle time enough on its own?
Usually no. It is strongest when paired with WIP and blocked-work monitoring so the team can see why work is slowing down.
What is the difference between cycle time and lead time?
Cycle time measures from when a work item enters active work to when it is done. Lead time measures from when the item was created to when it is done, so it also captures time spent waiting before work started. The Cycle Time view can switch between both.