WIP monitoring for Azure DevOps teams trying to stop bottlenecks earlier
Buyers looking for Azure DevOps WIP monitoring are usually trying to create a healthier “stop starting, start finishing” culture. Agile Analytics surfaces WIP pressure and aging work inside the team’s existing workflow: the WIP Monitor view checks every configured team against its own limit, and the Aging Chart shows how long each in-progress item has sat without finishing.
Why WIP problems surface too late
- Work piles up in progress without a clear signal for when the system is overloaded
- Aging work and blocked items become visible too late
- Teams want continuous monitoring without running another platform
What Azure DevOps WIP monitoring gives you
- See every configured team’s work in progress against its own WIP limit, with one headline verdict and a load chart sorted by risk
- Highlight blocked or slow-moving items before they derail sprint outcomes, with age thresholds calibrated to your own cycle time history
- Post a Teams or Slack alert to your own channel when a team goes over its limit, sent from your tenant with no publisher relay in between
What the WIP Monitor in Agile Analytics actually counts
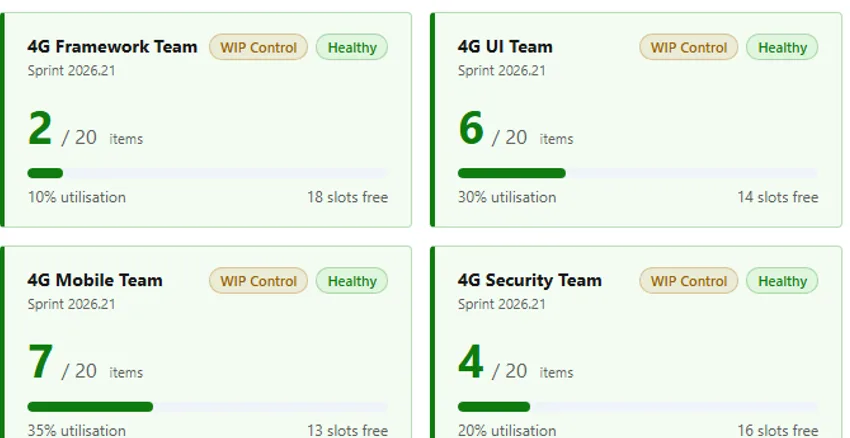
WIP Monitor is the Azure DevOps view for one question: which teams are carrying more work in progress than they agreed to. You configure the teams to watch, and a WIP limit for each, in the WIP Rules panel under Configuration. For every configured team the view reads the active sprint and counts the work items that have started and not yet finished, using your saved workflow mapping so a custom state such as "Code Review" still counts as in progress. Current WIP divided by the limit gives a utilisation percentage, and each team lands in one of three statuses: healthy, near limit, or over limit. How early a team is called "near limit" is a threshold mode you choose: Conservative warns with the most headroom, Aggressive warns latest, and Standard sits between. A team with no active sprint, no data, or a failed read is shown as exactly that. Agile Analytics never quietly labels a team it could not check as healthy.
The headline verdict and the team load chart
The top of the WIP Monitor is a single sentence: "2 of 7 teams over their WIP limit", "1 of 7 teams near their WIP limit", or "All 7 teams within their WIP limits". If some teams could not be read, the sentence says how many were checked and how many were not, rather than implying the unreadable ones passed. Below it, a stat strip counts teams, over, near, and healthy, and a load chart draws every team as a bar on a shared percentage axis with reference lines at 85 and 100 percent, so an over-limit team is visually obvious from across the room. The chart sorts by risk (breaches first, then warnings, busiest first within each), by utilisation, or alphabetically, and can be capped to the top N teams while the verdict and counts still cover every team. Switch between item count and story points for the bars; when points are on, the view tells you how many in-progress items carry no estimate instead of silently counting them as zero. The footer stamps the snapshot time honestly: counts can be served from a short session cache, so it says "Snapshot" rather than pretending each open was a fresh read.
WIP history: whether a team is drifting toward overload
The History tab turns the same count into a trend. Pick a team and a number of past sprints (eight by default) and the view plots work in progress measured at each sprint’s midpoint, alongside a per-sprint table. A team whose WIP climbs sprint over sprint while its throughput stays flat is accumulating queue, and that pattern is visible here weeks before it shows up as a longer cycle time. This is the same history the Flow Metrics view uses for its Little’s Law check, so the two views can never disagree about what WIP was. Both tabs export to CSV for retrospectives and management reporting.
Aging work items and blocked work in the same place
A team can be inside its WIP limit and still have three items that have not moved in two weeks, which is why WIP monitoring in Agile Analytics pairs the WIP Monitor with the Aging Chart (the Aging & Blocked view). It lays out in-progress work lane by lane and shows how many days each item has spent in its current status, with stage history chips showing where the item has been, grouped into age buckets so the stale items are the first thing you see. Blocked work is detected from the signals teams actually use in Azure DevOps: a Blocked tag, the Blocked field, a blocked state or board column, or a marker in the title, and those items are listed separately with the reason. The trend chart draws three zones (healthy, watch, stale) from your own team’s 50th and 85th percentile cycle time rather than an industry rule of thumb, so "old" means old for this team. Finished sprints are replayed as of their end date, so a retrospective looks at what the sprint actually looked like instead of today’s board, and items in states your mapping does not cover are counted and disclosed rather than dropped.
Alerts to Teams or Slack when a team crosses its limit
Each watched team can point at a Microsoft Teams or Slack incoming webhook. When Agile Analytics evaluates WIP and finds a team over its limit (or near it, if you keep that alert on), it posts a short message such as "Platform team: WIP 9/8 (limit exceeded)" to that channel, with a link back to the view. Alerts are de-duplicated per browser session so a channel is not flooded with the same breach. One honest limit worth knowing before you plan around it: the check runs when someone has Agile Analytics open inside Azure DevOps, because there is no publisher-hosted backend reading your work items on a schedule. That is the same design choice that keeps your work item data inside your Azure DevOps tenant and means the extension needs no personal access token. The webhook call goes from your browser to your own Teams or Slack endpoint, and only to Microsoft and Slack webhook hosts, never through a relay we operate.
See WIP and flow features
The WIP Monitor, the Aging & Blocked view, and the rest of the flow analytics set: cycle time scatterplot, cumulative flow, flow efficiency trends.
Open page →Read the WIP guide
Why WIP discipline is the lowest-cost lever for shorter cycle times, and how to set realistic limits without slowing the team down.
Open page →See cycle time analytics
The other half of the flow picture: percentile-based cycle time, service expectations, and how WIP discipline shows up in the numbers.
Open page →WIP monitoring questions
Does WIP monitoring only help Kanban teams?
No. Scrum teams also benefit because overloaded in-progress work often explains late burndown movement and unstable sprint completion patterns.
Is the WIP limit set per board column or per team?
Per team. In the WIP Rules panel you add each team you want watched and give it one limit for total work in progress, plus a threshold mode that decides how early it is flagged as near the limit. The Aging Chart is the view that breaks work down lane by lane.
Do the WIP alerts run when nobody has the dashboard open?
No, and we would rather say so than imply otherwise. WIP is evaluated when someone has Agile Analytics open in Azure DevOps, and any Teams or Slack alert is posted from that session to your own webhook. There is no publisher-hosted service polling your work items, which is also why your data never leaves your tenant and no personal access token is needed.
What is the practical benefit for managers?
It turns invisible flow risk into something the team can talk about daily instead of only discovering it at the end of the sprint.