Azure DevOps already records everything the four DORA metrics need. Pipelines know when each run finished and whether it succeeded. Boards knows when each work item became active, when it closed, and when each bug was opened and fixed. What Azure DevOps does not have is a DORA view that puts those together. This guide explains each metric, which Azure DevOps data feeds it, how to calculate it without fooling yourself, and how to set it up in Agile Analytics, an extension that shows the four metrics inside Azure DevOps Services (cloud) using read-only scopes.
The four DORA metrics
DORA metrics come from the DevOps Research and Assessment program, a long-running study of software delivery performance. It reduced "how good are we at shipping software?" to four measures, two for speed and two for stability:
- Deployment frequency: how often you successfully release to production.
- Lead time for changes: how long a change takes from being started to running in production.
- Change failure rate: the share of changes that cause a failure needing a fix, a rollback or a hotfix.
- Time to restore service: how long it takes to recover when a change does fail.
Three ways to get DORA metrics from Azure DevOps
Teams usually end up on one of three paths. Each one works; they differ in effort and in where your data goes.
Build it in Power BI or on the REST API
The Azure DevOps Analytics service, its OData feed and the REST API expose pipeline runs and work item history. A Power BI report can join them. Expect to make every decision this guide covers yourself (which pipelines deploy, which dates count, how to treat bugs), then maintain the model and its refresh schedule. It is the most flexible path, and it needs an owner for as long as people use the report.
Use an engineering intelligence platform
Several commercial platforms compute DORA metrics well. Many do it by copying your delivery data into their own cloud, so plan for a security review of a third party holding your work item and pipeline history.
Measure inside Azure DevOps
An extension can read the same data in your Azure DevOps session and show the numbers in a hub next to Boards. Agile Analytics takes this path. It requests four read-only scopes (vso.project, vso.work, vso.graph and vso.build) and cannot create, update or delete anything in Azure DevOps. Your work item content stays in your own tenant.
Deployment frequency: decide which pipelines deploy
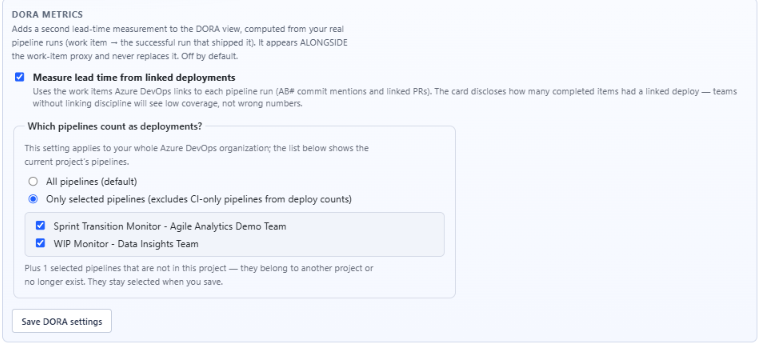
The source is completed pipeline runs. Count the successful runs of the pipelines that deploy, over an explicit window, and divide by weeks. Nine successful deploy runs in 30 days is 2.1 per week. The one decision that matters is which pipelines count. If every CI build on every branch counts as a deployment, the number is meaningless and flatters the team. In Agile Analytics the Deployment frequency card counts runs with a result of Succeeded or PartiallySucceeded and shows the rate as runs per week. Configuration, DORA Metrics has a setting called "Which pipelines count as deployments?" with two choices: "All pipelines (default)" or "Only selected pipelines". It applies to the whole organisation. Until you pick your deployment pipelines, the card shows the rate without an Elite, High, Medium or Low grade and says "Select your deployment pipelines to grade this".
Lead time for changes: start with work items, add deployments
Strictly, lead time for changes runs from commit to production. Few teams can trace every commit to a production deploy on day one, so start with a proxy you already have and add deployment data when it is available. The DORA Metrics view shows both:
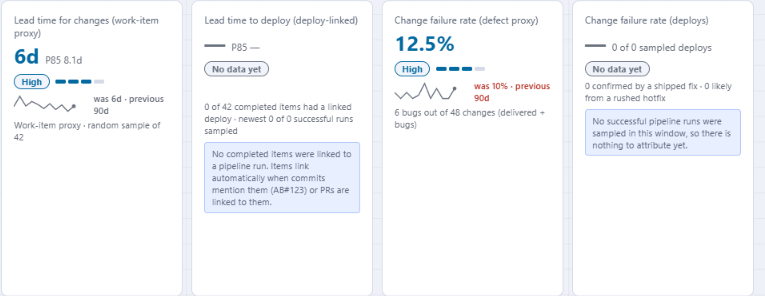
- Lead time for changes (work-item proxy): the days from a work item becoming active (Activated Date) to closing, across completed delivery items. Bugs, tasks and test work items are left out. The card shows P50 as the headline and P85 beside it, with the sample size.
- Lead time to deploy (deploy-linked): an opt-in measure. Tick "Measure lead time from linked deployments" in Configuration, DORA Metrics, and the view finds the earliest successful run linked to each completed item, through AB# mentions in commit messages or pull requests linked to the work item. It samples the newest 100 runs and tells you how many completed items had a linked deploy.
Make deploy-linked lead time work
Link work to code. Write AB#1234 in commit messages, or link the pull request to its work item, which Azure DevOps can require through a branch policy. The higher the share of completed items with a linked deploy, the closer the number gets to true commit-to-production lead time.
Change failure rate: two measures, labelled honestly
A change fails when it needs remediation. Without incident tooling, the nearest signal in Azure DevOps is bugs. The Change failure rate (defect proxy) card divides the bugs opened in the window by the changes in the same window, where changes are completed non-bug items plus those bugs. In the screenshot below that is 6 bugs out of 48 changes, 12.5%. The proxy is a useful health signal, but it measures how buggy the work is, not how risky each deployment is. The Change failure rate (deploys) card answers the DORA question more directly. It calls a deployment failed only when two signals agree: a bug was opened after it, and a later deployment shipped that bug's fix. Rushed follow-up deploys are shown separately as likely failures. It uses the same opt-in and pipeline choice as deploy-linked lead time.
Time to restore: measure from bug opened to bug closed
Time to restore asks how long recovery takes. The Time to restore (bug-close proxy) card measures the hours from a Bug being created to being closed, and shows P50 and P85 rather than an average, so one week-long outlier does not define the number. It reads work items of type Bug only. If your production incidents live in another work item type or outside Azure DevOps, this card will not see them; check that before you report the number upward. Closing bugs when the fix is deployed, not when the code is merged, keeps the proxy close to real recovery time.
Five things that skew DORA numbers in Azure DevOps
Most arguments about a DORA number trace back to one of these. Check them before you share the figures.
- One run is one deployment. A pipeline that deploys to test and production in the same run counts once, and a run that only reached staging still counts. Select the pipelines whose runs end in production.
- PartiallySucceeded runs count as successful deploys. If your pipeline reports a partial success when an optional step fails, those runs are in the rate.
- The change failure proxy counts bugs by the date they were opened, so a bug logged today for a defect that shipped a year ago raises this window's rate. A backlog clean-up week can do this on its own.
- Team scope comes from the team's area paths. If that lookup fails, the view falls back to the whole project and shows a warning, so other teams' work can end up in the number.
- Short windows are noisy. A team that deploys weekly has about two deploys in a 14-day window, so one late release halves the rate. Use 30 or 90 days for anything you report upward.
What good looks like
The DORA research groups teams into performance bands. The DORA Metrics view grades each card Elite, High, Medium or Low with these thresholds:
- Deployment frequency: Elite at 14 or more deploys a week, High at 1 or more, Medium at 1 every 4 weeks or more, Low below that.
- Lead time for changes (P50): Elite at 1 day or less, High at 7 days or less, Medium at 30 days or less.
- Change failure rate: Elite at 5% or less, High at 15% or less, Medium at 30% or less.
- Time to restore (P50): Elite at 1 hour or less, High at 24 hours or less, Medium at 1 week or less.
Read the four together
Use the bands for orientation, not as targets. A single metric used as a target gets gamed: deployment frequency rises when releases are split, change failure rate falls when bugs are reclassified. Speed and stability check each other, so read all four side by side and compare quarters, not sprints. A Build failure rate card sits next to them, read from the same pipeline runs; it has no band.
Set it up in about five minutes
The native route needs no data pipeline and no data model:
- Install Agile Analytics from the Visual Studio Marketplace. The 30-day free trial needs no card.
- Have an organisation administrator approve the four read-only scopes. vso.build is the one that unlocks pipeline-based deployment frequency.
- Open Boards, then Agile Analytics, then DORA Metrics. Pick a team and a Window of 14d, 30d or 90d (30 days is the default).
- In Configuration, DORA Metrics, choose "Only selected pipelines" and tick the pipelines that deploy to production. Tick "Measure lead time from linked deployments" if you want the deploy-linked measures, then select "Save DORA settings".
- Read the cards with their sample sizes. Work item measures use a random sample of up to 200 items, and the card says so.
Put the numbers on an Azure DevOps dashboard
The DORA Snapshot tile shows the four keys on any Azure DevOps dashboard for one team over a 30-day window: Deploys/week, Lead time p50, Change failure (proxy) and Restore p50. It honours the same deployment pipeline choice as the hub. Add it from the widget catalog under "Agile Analytics" and pick a team in its Configure panel. Like the hub, it needs a trial or a subscription.
Related: What each Azure DevOps dashboard widget should show · Agile Analytics for Azure DevOps: overview · Azure DevOps reporting, board-ready · Delivery metrics executives actually read